How to Read Commodity Price Forecasts: Building 1-Month and 3-Month Supply-Demand Scenarios

Read enough commodity price forecasts and you'll notice something odd. For the same commodity over the same period, every institution seems to land on a different number. One calls for higher oil prices; another sees a supply glut dragging them down. If you're in procurement, that leaves you with hard questions. Which number do you anchor to? When do you buy, and how much? And how do you build a cost plan around any of it?
This article looks at commodity price forecasts from a buyer's point of view. We'll walk through how to build 1-month and 3-month scenarios from supply-demand signals like inventories, production, and consumption, and how to translate those scenarios into a purchasing plan. Rather than betting on a single number, frame your view as "if these conditions hold, prices are likely to move this way." When a forecast misses, you can then reset quickly instead of starting from scratch.
Why Do Commodity Price Forecasts Miss So Often?

Commodity prices are shaped by two forces working at once. The first is physical supply and demand. When a mine goes offline or a harvest comes in short, less material reaches the market. When factory utilization rises, demand for raw materials rises with it.
The second force is financial. Most commodities are priced in dollars, so a stronger dollar makes them more expensive for buyers paying in other currencies. Higher interest rates raise the cost of carrying inventory. And when market sentiment swings hard in one direction, prices often move further than the underlying fundamentals justify.
Forecasters make assumptions about each of these variables and publish a number. Change just one of those assumptions, though, and the final figure can shift dramatically, which is why forecasts miss so often. For practitioners, the more useful question isn't "How accurate was the forecast?" It's "How quickly did we notice when the assumptions changed?"
Q. Don't we still need a single reference price for budgeting?
That's a fair point. You can't build a budget or run cost calculations without a reference price, and scenario planning doesn't ignore that. The usual practice is to use the base-case price as the budget rate and set out a separate price range for the upside and downside cases. In other words, you don't just plug in a number; you document the conditions behind it.
Q. Aren't markets inherently unpredictable?
Most people agree it's hard to call short-term price direction consistently. But buyers can't keep putting off decisions just because forecasting is hard. How much volume to lock in this month, how much to put under long-term contracts: these calls have to be made eventually. Supply-demand scenarios give those decisions a rationale and leave a record you can revisit when conditions change.
Why Do 1-Month and 3-Month Scenarios Look at Different Things?
On the surface, 1-month and 3-month scenarios seem to differ only in time horizon. In practice, they're looking at entirely different volumes.
Supply can't ramp up much in a month. Expanding refining capacity takes months to years, and bringing a new mine online typically takes a decade or more. So a 1-month scenario focuses on what's already out there: inventories already in the market or sitting in warehouses and exchange stocks, spot premiums, port and shipping conditions, and sudden disruptions like strikes or extreme weather.
Give it three months, however, and the market has time to respond. When prices rise, producers adjust output or run plants harder, while buyers look for substitutes or push back purchases. A 3-month scenario therefore focuses on volumes yet to be produced and volumes yet to be consumed. The variables in play include production plans, capacity utilization, seasonal demand, purchasing managers' indexes (PMIs) as a gauge of manufacturing activity, trade policy, and exchange rates.
Here's a simple way to think about it. A 1-month scenario is like checking what's left in the fridge right now. A 3-month scenario is like figuring out when to do the next grocery run and how to plan for the guests you're having over.
Five Steps to Building a Supply-Demand Scenario
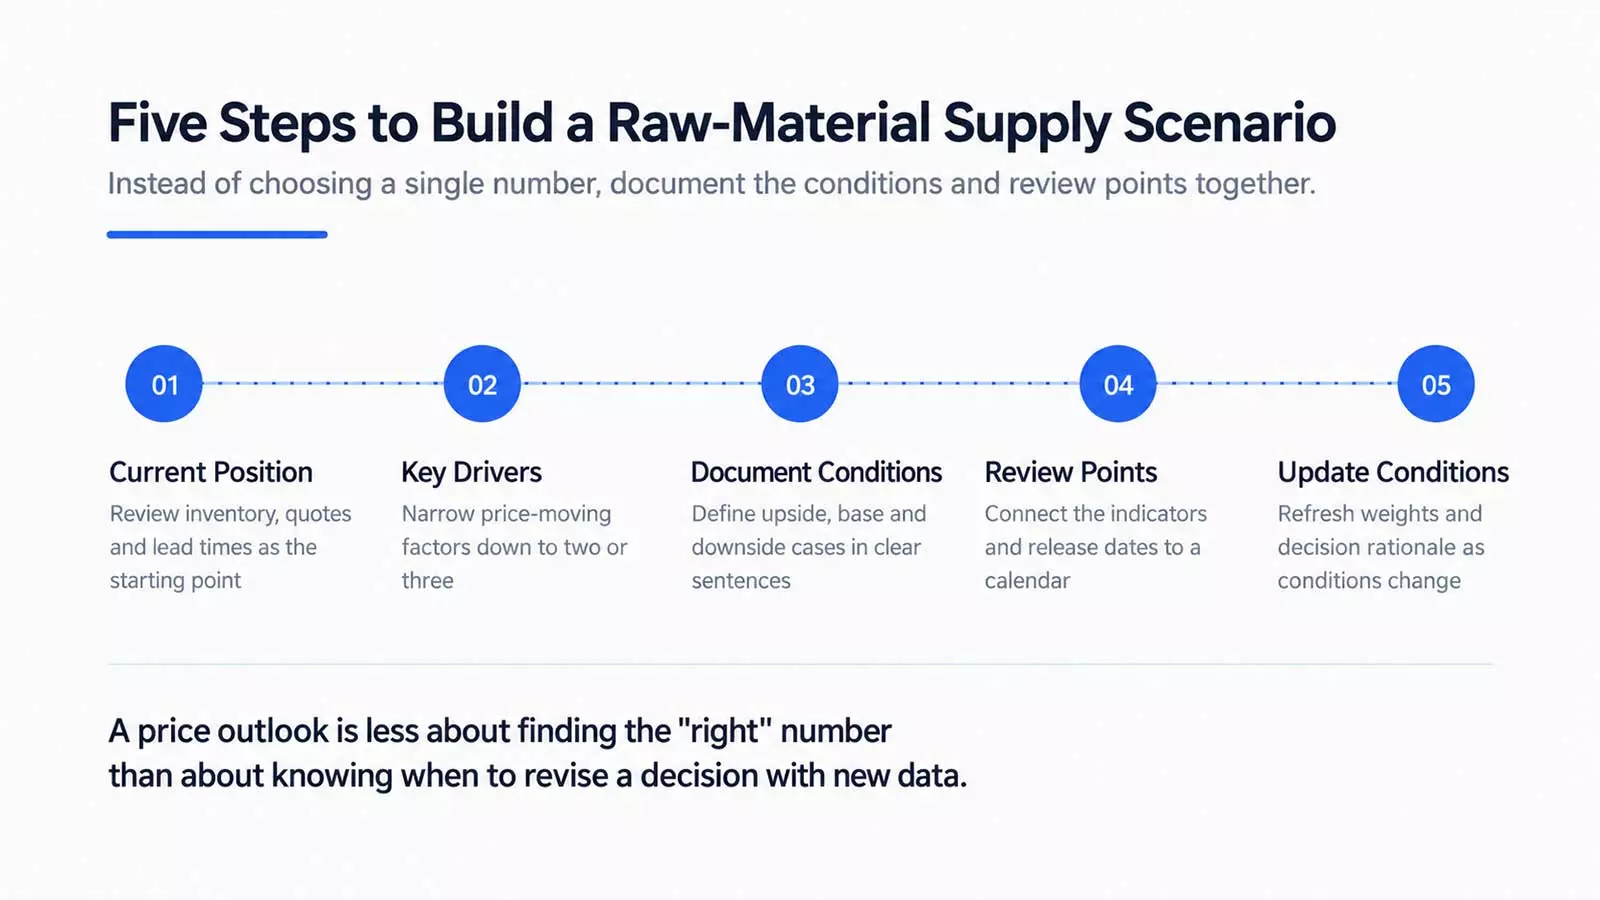
Step 1. Establish where you stand. Check whether inventories are above or below the average for this time of year, and how supplier quotes and lead times are trending. A clear starting point keeps later judgments from drifting.
Step 2. Narrow your focus to two or three key variables. Dozens of factors influence commodity prices, but at any given moment only a handful are actually moving the market. In copper, for example, the direction of China's economy or production disruptions at major South American mines might matter most during a particular stretch. Track too many variables and the scenario becomes hard to keep updating.
Step 3. Write out your upside, base, and downside conditions in full sentences. Instead of simply writing "prices will rise," spell out the conditions: "If production disruptions at major mines continue into next month and exchange inventories keep falling, the upside scenario becomes more likely." The more specific the conditions, the easier it is to check later whether your call was right.
Step 4. Map each indicator to its release schedule. The U.S. Energy Information Administration (EIA) publishes U.S. crude inventories weekly, and the USDA's WASDE report comes out monthly. Since release cycles vary by indicator, marking them on a calendar makes it clear when each scenario review is due.
Step 5. Review with every new data release, but only adjust weightings when your predefined conditions change. You might start with 50% on the base case, 35% on the upside, and 15% on the downside, then raise the upside weighting if inventories draw down faster than expected. These weightings aren't strict probabilities. They serve as a record of why the team changed its view. The percentages here are illustrative and can be set differently depending on the commodity and market conditions. When volatility picks up or a commodity's risk is skewed to one side, asymmetric weightings make sense. Oil is generally seen as carrying more upside risk, while copper is exposed to sharp event-driven moves in both directions.
What Should You Watch for Each Commodity?
Each commodity has its own price drivers, so start by defining indicators for the materials your company actually buys. Below, we look at four commodity groups closely tied to costs for manufacturers and distributors.
Crude Oil Price Outlook
Crude prices feed into fuel and logistics costs, as well as petrochemical-based inputs like plastic packaging. The EIA publishes weekly crude and petroleum product inventories along with its monthly Short-Term Energy Outlook (STEO), while the International Energy Agency (IEA) and OPEC each release monthly oil market reports. Their demand forecasts often diverge, so rather than following any one agency's number, it's more useful to watch whether the gap between them is widening or narrowing.
For a 1-month scenario, focus on weekly inventory data and production announcements from major producers. For a 3-month scenario, look at seasonal demand and producers' output plans.
Copper and Aluminum Price Outlook
For copper and aluminum, which go into wire and cable, electrical and electronic components, and construction materials, buyers keep a close eye on stocks in exchange-approved warehouses such as those registered with the London Metal Exchange (LME). Look beyond total stocks to the share of cancelled warrants. Cancelled warrants represent metal that holders have taken off exchange registration in order to load it out of the warehouse. The metal is still physically there, but it can no longer be delivered against exchange contracts. When that share jumps, registered stocks the market can actually access may be tight even if total stocks look comfortable. That said, warrants can also be cancelled or re-registered for reasons unrelated to end-user demand, such as load-out queues or transfers between warehouses, so cross-check against physical market signals like spot premiums. In July 2026, for example, copper flowed into the U.S. ahead of expected tariffs, pushing the cancelled-warrant share of LME copper stocks as high as 62.3%. As metal was later re-warranted, the share eased back to around 29% and the market settled down.
For a 3-month scenario, track manufacturing PMI in China, the world's largest metals consumer, along with copper market balance forecasts from the International Copper Study Group (ICSG) and statistics from the International Aluminium Institute (IAI).
Iron Ore Price Outlook
Iron ore weighs heavily on the steel and construction sectors, and China's steel production is its single biggest demand driver. In a 1-month scenario, watch iron ore stocks at major Chinese ports and shipments from Australia and Brazil, the top exporters. In a 3-month scenario, China's property and infrastructure activity and its steel output curbs become the key variables. For Korean-language coverage, KOMIS, the mineral information service run by the Korea Mine Rehabilitation and Mineral Resources Corporation (KOMIR), tracks price trends for major minerals.
Grains and Oilseeds Price Outlook
Grains and vegetable oils such as corn, soybeans, wheat, and palm oil hit food manufacturers' costs directly. Weather and crop conditions are the biggest swing factors. The USDA's monthly WASDE report, which covers production, consumption, and ending stocks forecasts for major grains, forms the backbone of a 3-month scenario. Focus on the stocks-to-use ratio, meaning ending stocks relative to consumption, rather than ending stocks alone. The same stock level leaves a thinner cushion when consumption rises. For palm oil, monthly inventory data from the Malaysian Palm Oil Board (MPOB) is a widely watched reference. For a 1-month scenario, weekly export inspections and weather forecasts for key growing regions offer useful clues.
Reading Supply-Demand Signals Through Days of Cover and FX
Days of Cover

Look at days of cover alongside absolute inventory levels. Days of cover is current inventory divided by average daily consumption, or how many days you could last with no new supply coming in. Even if inventory holds at 1 million tonnes, days of cover shrinks as consumption rises. Comparing against the historical average for the same time of year also strips out seasonality. That comparison matters most for products whose stocks naturally rise and fall with the seasons, like heating oil in winter.
Supplier Quotes and Lead Times
Shifts in the spot market usually show up first in your dealings with suppliers. If quoted premiums rise, lead times stretch, or suppliers get stingier with allocations than usual, near-term supply is likely tightening. Conversely, if suppliers start reaching out with offers or there's more room to negotiate on price, supply may be loosening. This kind of on-the-ground intel often moves faster than published data, so it pays to log what your buyers are seeing at each scenario review.
Exchange Rates
For companies that buy in dollars but operate in another currency, such as Korean manufacturers watching KRW/USD, the exchange rate can matter as much as the commodity price itself. Even if international copper prices hold steady, a weaker won pushes up procurement costs in local currency. Running the dollar-denominated price and the local-currency procurement cost separately in your scenarios makes it easier to tell whether a cost move is coming from global fundamentals or from FX.
In practice, teams break local-currency cost changes down into a price effect and an FX effect, build the FX scenario separately from the commodity scenario, and then look at the two together. The catch is timing: when exactly does the exchange rate get locked in? The commodity price is set against a predefined quotational period (QP), such as the average for the month of shipment. The FX rate, however, may be fixed on the shipment date, the customs clearance date, or the payment date, depending on the company. When those dates don't line up, price risk and FX risk crystallize on different days, so confirm your company's FX convention first.
1-Month and 3-Month Scenarios at a Glance
How to Turn Scenarios into a Purchasing Plan
Scenarios only earn their keep once they're tied to a purchasing plan. Deciding in advance which buying responses to consider under each scenario means you don't have to restart the discussion from zero every time the signals shift. The table below shows responses commonly used in practice, though the right moves will vary by industry, commodity, and inventory policy.
Raw material price changes flow through to product costs with a lag that depends on your inventory valuation method. Sharing procurement's scenarios with finance and sales lets you line up cost planning and pricing negotiations ahead of time. This is where commodity price forecasting stops being procurement's homework and becomes a company-wide cost management tool.
Keep in mind, though, that Korean manufacturers often buy raw materials under annual contracts with prices indexed to international benchmarks, for example a monthly average price plus a premium. In that setup, the real levers go beyond when and how much to buy. They also include the share of volume priced on a fixed basis, the pricing period and contract structure, and whether selling prices are indexed as well. Here's how that plays out across industries.
Wire and cable makers that use base metals typically sell at prices indexed to international benchmarks. Their core task isn't managing the price level but managing the gap between when selling prices are locked in and when raw materials are bought. When prices are rising, they fix raw material prices as soon as orders come in. When prices are falling, they manage valuation losses on uncommitted inventory while looking for chances to buy lower.
Food manufacturers that use grains and oilseeds usually contract the benchmark price and the basis, the premium tied to origin and freight terms, separately, and often buy three to six months ahead. Because cost increases are hard to pass on to customers, protecting against rising prices is especially critical. When prices are rising, they increase the share priced in advance and extend forward coverage. When prices are falling, they stagger pricing dates and lock in the basis first.
In construction and heavy industry, where steel is the key input, iron ore is bought under long-term contracts indexed to quarterly or monthly averages of overseas price indexes, while steel products like rebar trade at quarterly base prices negotiated between steelmakers and builders. Because the quarterly negotiation calendar, not the market price, determines when decisions actually get made, buyers secure volume ahead of negotiations when prices are rising and use market trends as leverage to push for a lower base price when they're falling.
Three Things to Check Before Reading a Commodity Price Forecast

First, check the data cutoff date. Agency forecasts state the date through which data was incorporated. The EIA's STEO, for instance, specifies the cutoff for its inputs in every edition. If a major event happened after that date, the numbers may already be out of step with current conditions.
Next, check the assumptions. For an oil forecast, the number can look very different depending on whether it assumes major producers will maintain output cuts or the global economy will slow. Once you know the assumptions, you can see which slot that forecast belongs in within your own scenarios.
Finally, watch for overconfident language. Forecasts peppered with words like "certainly" or "definitely" have likely skipped over the conditions. The more clearly a forecast lays out its rationale and conditions, the easier it is to fold into a scenario.
"Can't we just follow the agency forecasts?"
Forecasts from credible institutions are an excellent starting point. But there's no guarantee their assumptions match your company's situation. Agency reports don't account for your buying calendar, inventory policy, or FX exposure. We recommend using agency forecasts as inputs to your scenarios and layering your company's own conditions on top for the final call. When citing an external forecast, record the publisher, publication date, data cutoff, and key assumptions together so you can trace your reasoning later.
Deepflow Materials: Support for Commodity Price Forecasting
The approach above is simple in principle but labor-intensive in practice. Every month, someone has to gather indicators for each commodity, update the data around release dates, and write up what changed. Once you're tracking dozens of materials, that's a lot to ask of one or two people.
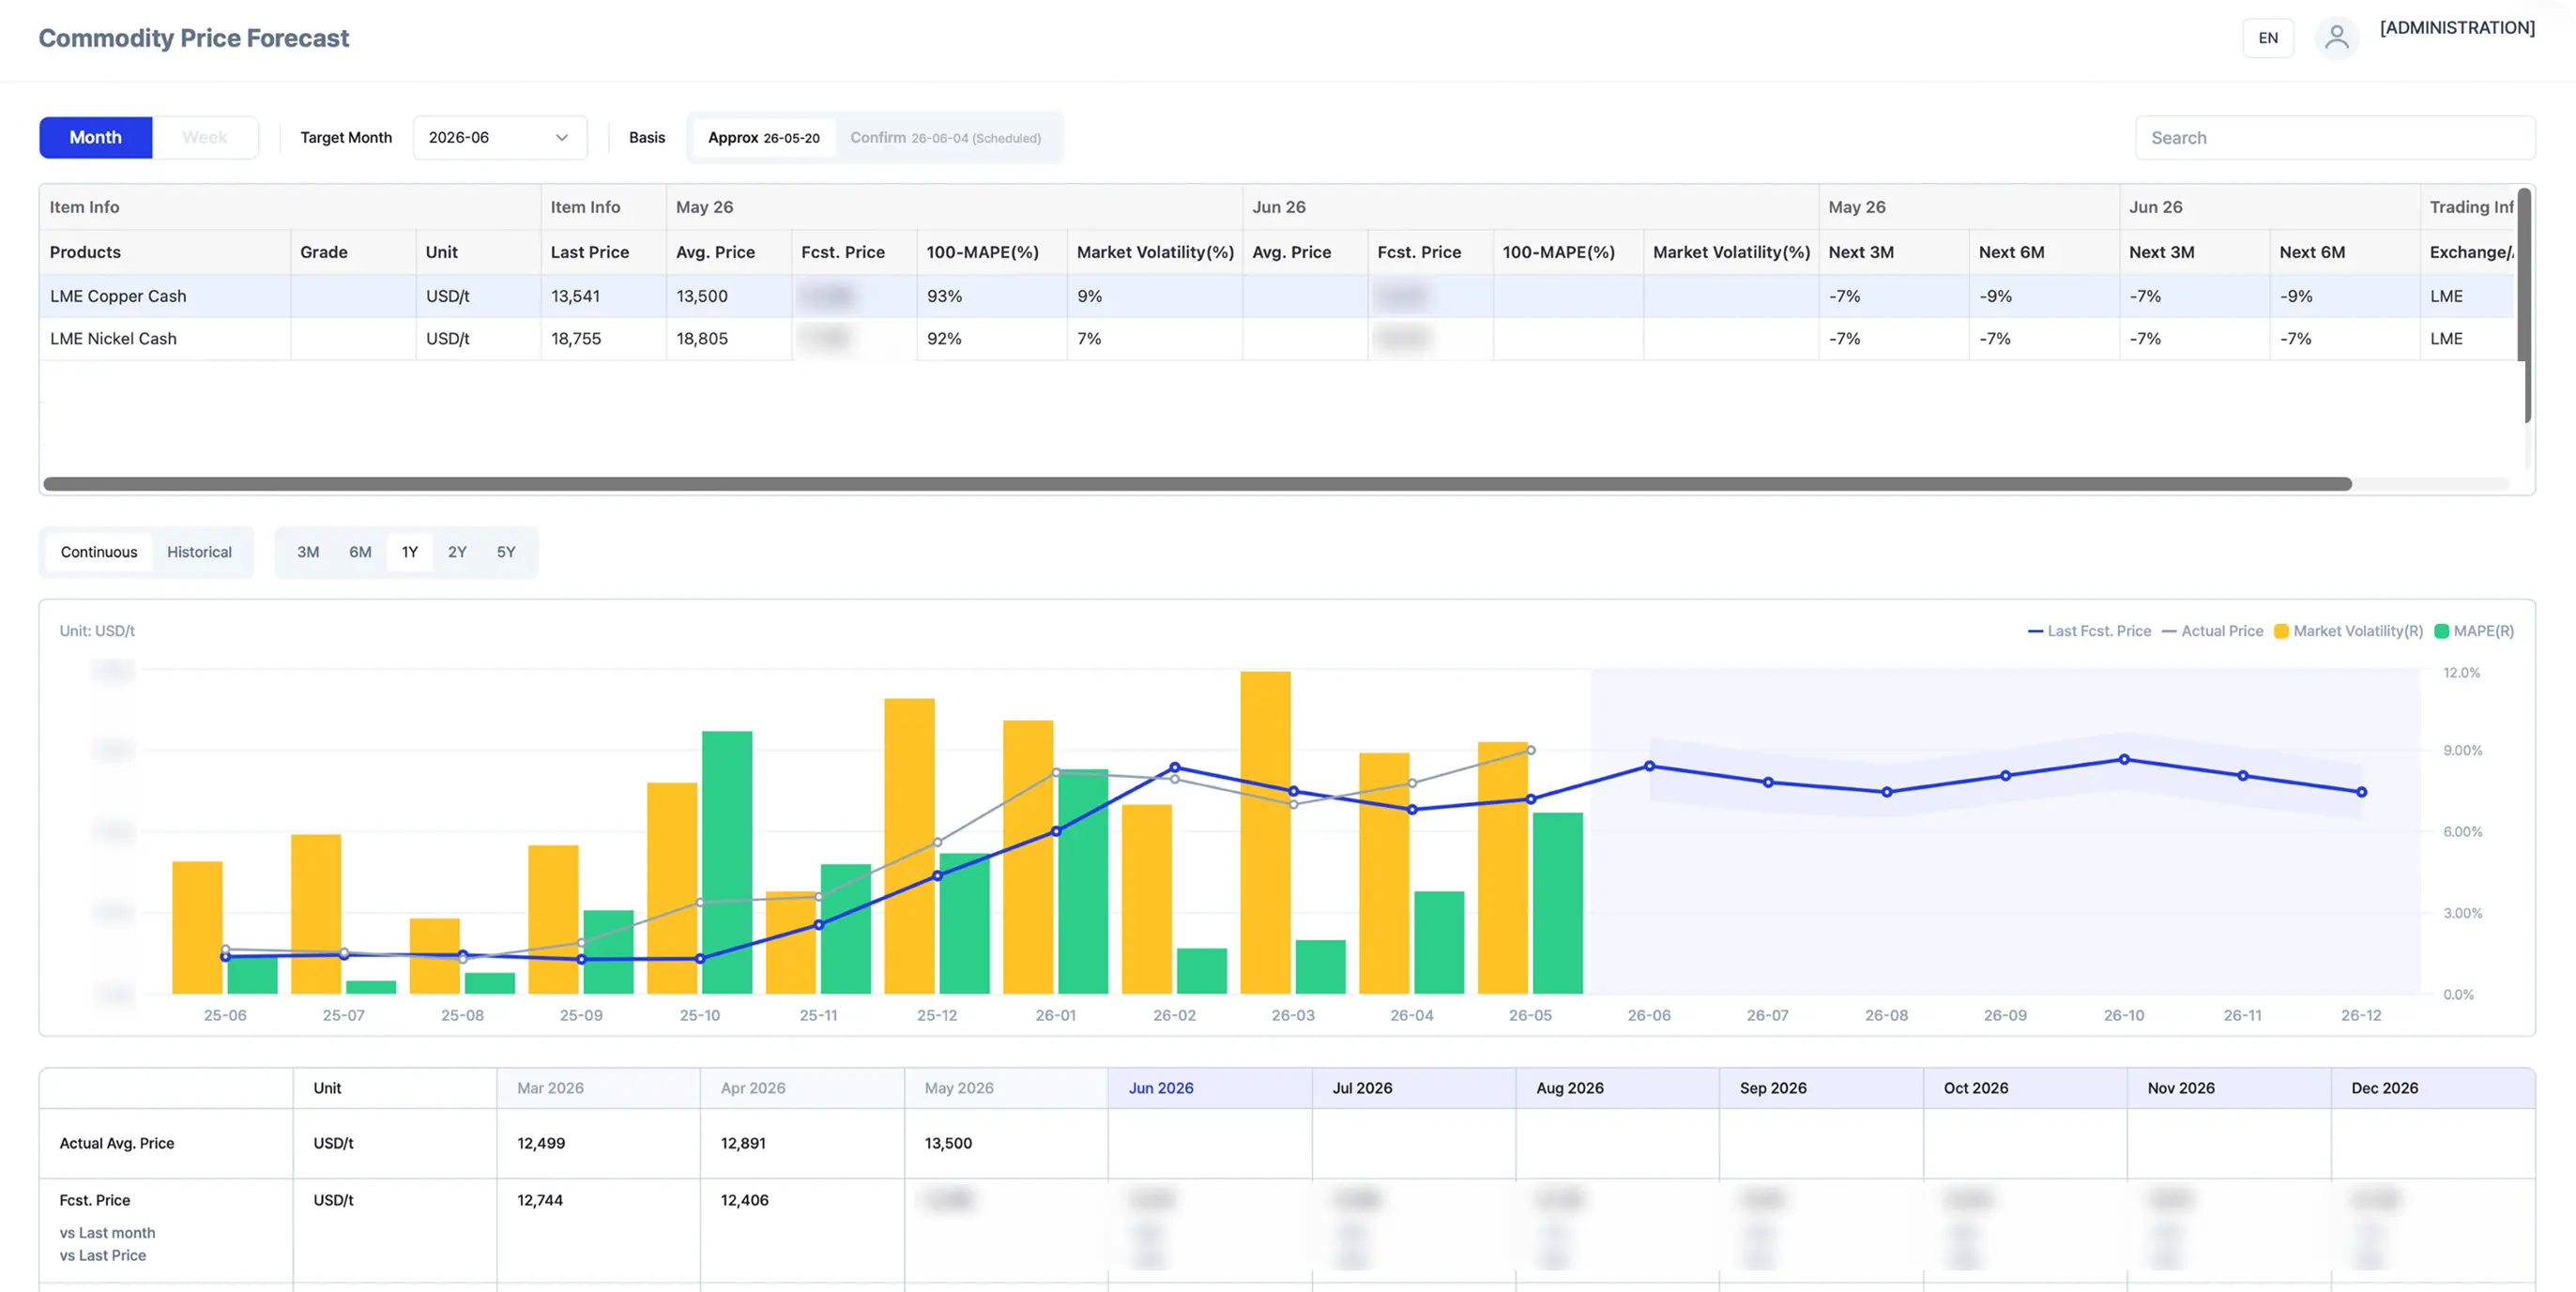
ImpactiveAI's Deepflow Materials is a commodity price forecasting solution built to support this process. It factors in supply-demand, macroeconomic, FX, and other variables that drive commodity prices to deliver price trends and forecasts. The model design already accounts for the fact that each variable affects prices with a different lag, so your team can focus on reviewing the results and the reasoning behind them.
Forecasts and Drivers on One Screen
Alongside each forecast, Deepflow shows which variables had the most influence on the outlook. No model gets every price right every time. When a forecast shifts or misses, you need to see which variables moved differently than expected in order to make a sounder next call. With those drivers in hand, your team can quickly pin down when and why to adjust scenario weightings.
LLM-powered analysis reports summarize forecast results in plain language and suggest action plans for procurement, production, finance, and other teams. In effect, the scenario-based purchasing responses and cross-functional sharing covered above come together in a single report. Final decisions on purchase timing and volume stay with your team, while Deepflow acts as a decision-support tool that organizes the evidence behind those decisions.
Three Questions to Ask Before Getting Started
- What data do we need? Deepflow supplies the market indicators and macroeconomic variables used for price forecasting. On your end, you'll need a list of target commodities and, if available, your historical purchase price data.
- How much prep work is involved? You can start at the commodity level without integrating your existing ERP or procurement system, so the lift is much lighter than an enterprise-wide system rollout.
- How are cost and scope determined? Rather than covering every commodity from day one, we recommend starting with a few that make up a large share of your costs. A narrower scope keeps costs down and lets you see first how the forecasts perform on your own materials.
See it with your own materials. Just tell us which commodities you're interested in, and we'll walk you through their price trends, forecasts, and the variables driving the outlook in a demo.
Commodity Price Forecasting FAQ
Should we start with the 1-month or the 3-month scenario?
Match it to your purchasing cycle. If you buy mostly on the spot market, a 1-month scenario will be more immediately useful. If you rely on quarterly contracts, the 3-month scenario will serve you better. Once you have the bandwidth to run both, use the 3-month scenario to set the overall direction and the 1-month scenario to fine-tune timing.
How often should scenarios be updated?
Review them in line with the release schedules of your key indicators, but only adjust weightings when your predefined conditions change. Revising scenarios with every day-to-day price swing can actually make your judgment less steady. Many teams set the release of monthly reports as their regular review date, though this varies by commodity and organization.
Better Commodity Price Forecasting Starts With Writing Down Your Conditions
Any organization can start today: map out the conditions under which prices move, then update your view each time new data comes in. Use a 1-month scenario to check near-term supply and a 3-month scenario to get ready for next quarter.
If you're managing too many commodities to keep this going consistently, Deepflow Materials can help. Request a demo with your list of target commodities, and see their price trends and forecasts for yourself.
[Request a Deepflow Materials Demo]
This article is provided for informational purposes to help readers understand commodity markets and plan purchasing. The agency reports referenced here may vary depending on when they were published and the assumptions behind them, so please refer to the latest editions.
References
EIA Short-Term Energy Outlook · IEA Oil Market Report · OPEC Monthly Oil Market Report · London Metal Exchange · USDA WASDE