Download Brouchure

Oops! Something went wrong while submitting the form.

When you're prepping for the month-end inventory review, you end up listing stockouts and overstocked items side by side. And more often than not, the same SKUs that showed up last month are back again. Stockouts and late deliveries tend to feel like they came out of nowhere, but in most cases small warning signs were already there, buried in shipment data, receiving records, or market indicators.
Even seasoned demand planners and inventory managers miss these signals because the clues are scattered all over the place. Sales is usually the first to notice when a customer changes how it orders. Supplier delays pile up one email at a time in the buyer's inbox. Ocean freight rates and exchange rates are tracked separately by logistics and finance. Each change looks minor from where each team sits, but when several of them hit the same SKU, they quietly snowball into stockouts or excess inventory.
In this article, we break supply chain risk signals down into three categories: demand, supply, and the external environment. We'll then walk through how to turn those signals into actual decisions once you've spotted them.
If you'd like to learn more about ImpactiveAI's supply chain content, take a look at these articles:
Why Do Procurement, Production, and Inventory Drift Apart? A Practical 5-Stage Guide to Supply Chain Management (SCM)
Designing a Demand Forecasting KPI Framework for Supply Chain Optimization
Supply chain risk signals are changes you can detect in your data before problems like stockouts, excess inventory, or late deliveries actually surface. Think of forecast error that keeps building in one direction, supplier receipts that drift a little later than the promised date each time, or key raw material prices and freight rates moving sharply out of their usual range.
A single signal doesn't confirm a problem on its own. But if similar signals keep recurring, or different types of signals show up on the same SKU at the same time, it's time to revisit order quantities, safety stock, and the sales plan.
We split these signals into three categories because each one shows up in different data, gets noticed by different people, and calls for different responses.
You can catch a lot of demand-side signals just by taking a closer look at the shipment data and forecast history you already have. With no extra data collection required, it's the best place to start.
MAPE is one of the most common ways to measure forecast accuracy. It calculates the gap between forecast and actual as a percentage of the actual, then averages it out. But a MAPE that sits steadily around 15% every month doesn't necessarily mean your forecast is stable. If that 15% comes from under-forecasting every single time, the picture changes. Small shortfalls in order quantities keep adding up until they suddenly surface as a stockout.
When error consistently leans in one direction regardless of its size, it's called forecast bias. Checking for it isn't hard. For each SKU, subtract actuals from forecasts over the past several months, sum the results with their signs intact, and see whether the total keeps building in one direction. Many demand planning teams also use a tracking signal, which divides this cumulative error by the mean absolute error. Where to set the alert threshold depends on your industry and the nature of the SKU.
If bias persists for several months in a row, check whether the market itself is shifting. If a new sales channel keeps lifting demand, or a competitor's launch is slowly eating into your share, forecasting off the old pattern will keep you off target in the same direction.
The shipment figures a manufacturer sees reflect what was delivered to retailers or distributors, which often differs from what consumers actually bought. When a retailer stocks up ahead of a promotion, the manufacturer's shipments spike while actual sales stay flat. The following month, shipments can drop sharply as the retailer works through that inventory. This phenomenon, where small shifts in consumer demand get amplified as they move upstream through retail, manufacturing, and raw material suppliers, is known as the bullwhip effect.
Bullwhip signals are especially common in industries that sell through distributors and retail channels, such as food, beverage, and household goods. If you can get POS or sell-through data from your customers, you can compare shipments against actual sales directly. In reality, though, data availability and frequency vary widely from one account to the next, so you can't see every channel equally. The practical approach is to start with your largest accounts by revenue and work your way down.
Even if total order volume holds steady, a change in how orders come in can shift your risk profile. If an account that used to place one large order a month starts splitting it into several smaller orders, it may be trying to cut its own inventory exposure. On the flip side, a sudden jump in early orders may mean the customer is building stock ahead of an expected price increase or supply disruption.
Keep an eye on sudden increases in any single account's share of orders, too. A schedule change or one canceled promotion from that account can then have an outsized impact on total demand.
There are times when sales data doesn't reflect true demand. In a month with a stockout, plenty of customers may have wanted to buy, but recorded sales come in low. If that number feeds straight into the next forecast, the forecast drops again and the stockouts repeat in a vicious cycle. Conversely, if a month inflated by an influencer mention or a one-off promotion goes into the forecast as is, it can lead to unnecessary inventory down the line.
You can't tell these apart by looking at the numbers alone. That's why planners need to flag months with unusual spikes or dips and note whether the cause was a stockout or a promotion. Only then can those outliers be filtered out when building future forecasts and inventory plans.
On the supply side, lead time is the first thing to check. Lead time is the time from placing a purchase order until the goods are received and actually available for sale or production. Many companies plug a fixed lead time into the item master, but supply-side risk often shows up first in the gap between that fixed value and when goods actually arrive.
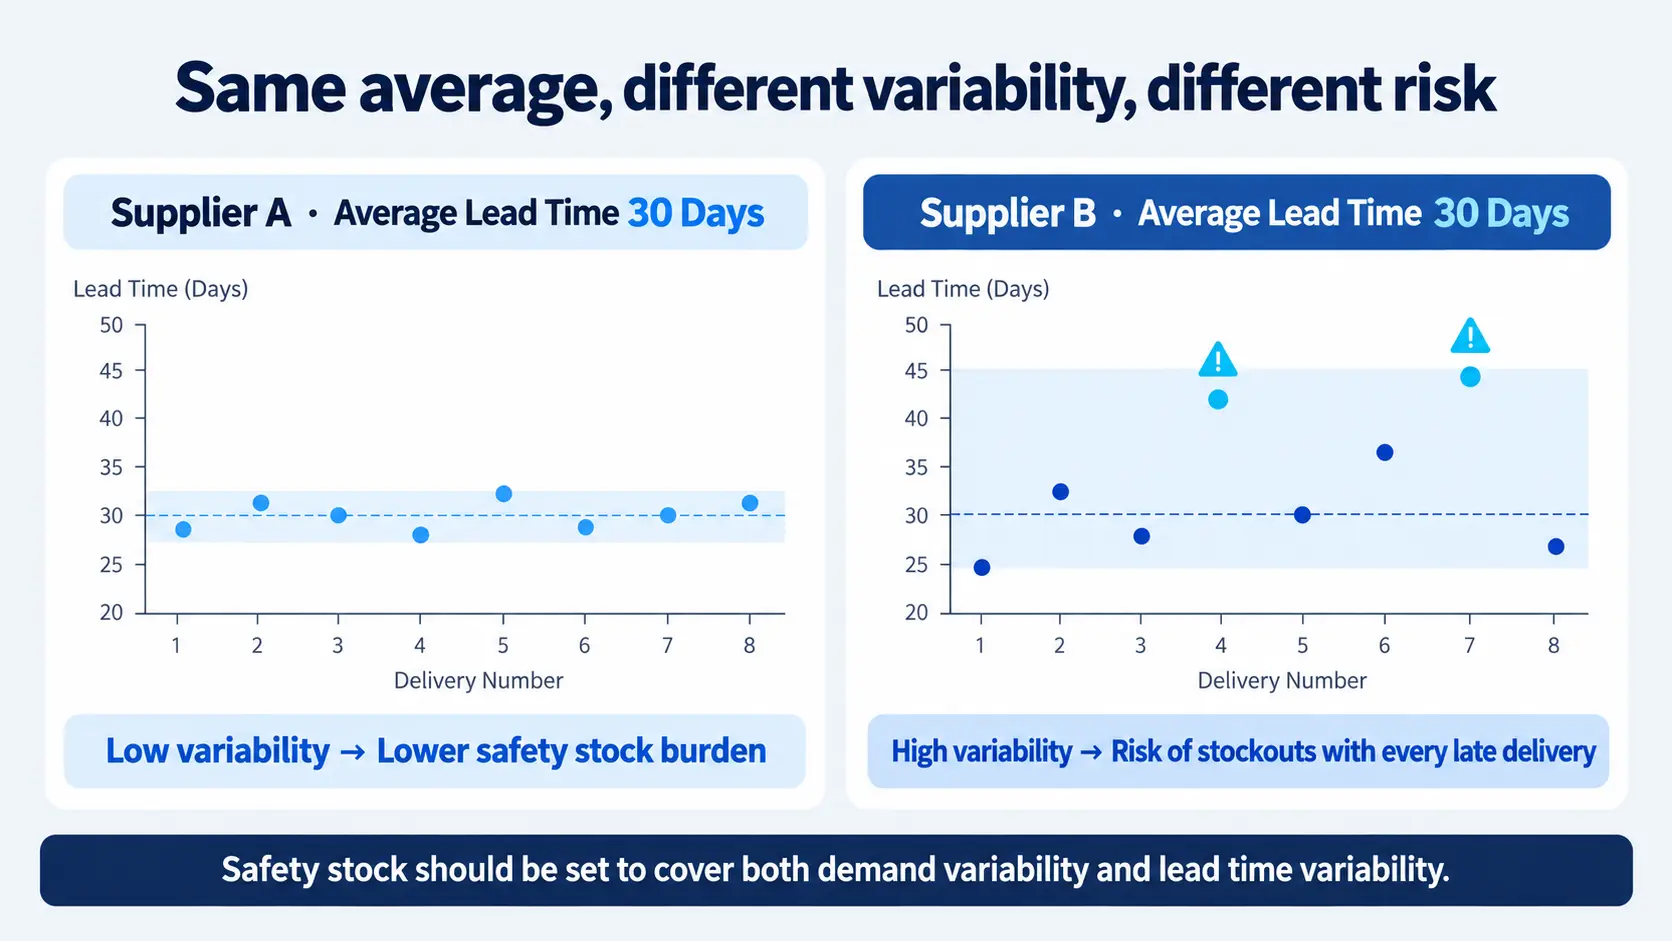
Say a raw material has an average lead time of 30 days. If receipts consistently land between 28 and 32 days, that's fairly stable. If they swing between 25 and 45 days, it's a completely different story. Safety stock needs to account for lead time variability as well as demand variability, so even with the same average, a wider spread means you need more safety stock. If you time orders based on average lead time alone, every late receipt raises your risk of running out.
Keep building up PO dates and actual receipt dates by SKU and supplier, and check whether the variance across recent receipts is widening. Lead time variability signals deserve particular attention in manufacturing that sources raw materials or components from overseas and in distribution businesses with a high share of imported goods.
A persistent gap between the supplier's promised delivery date and the actual receipt date is another important warning sign. If delays start at a day or two and gradually stretch to a week, or if shipments that used to arrive in full start coming in partial deliveries, the supplier may be running short on production capacity or raw materials.
To make this comparison, you need to record the supplier's original promise date separately. If you overwrite the same field every time the date changes, you lose the gap between the original commitment and the actual outcome, and the signal becomes hard to catch.
Watch for moves to change supply terms as well, such as a supplier asking to raise the minimum order quantity (MOQ), renegotiate pricing, or change payment terms. These often signal that something has changed on the supplier's end, whether rising costs, shifting production schedules, or cash flow pressure. One such change alone doesn't confirm a supply disruption. But if the same supplier is showing both late deliveries and changing terms, it's wise to map out which SKUs depend on that supplier and be ready to act quickly.
Beyond late deliveries, a rising rate of rejects or rework at incoming inspection is another signal to watch. Goods may be received on paper while usable inventory is actually short. If quality issues keep recurring, move that supplier up your monitoring priority list.
External signals originate outside your company and often affect demand and supply at the same time. Most of them are publicly available indicators anyone can check, but it's up to the planner to judge how closely each one relates to your own SKUs.
Ocean freight rates are a relatively fast way to read shifts in global logistics capacity. When a regularly published freight index like the Shanghai Containerized Freight Index (SCFI) rises well above normal levels, tight vessel space or port congestion that stretches transit times often comes with it. If imported materials or goods make up a large share of your business, it pays to track freight index movements alongside your lead time signals.
Exchange rates and commodity prices hit costs directly and also shift supply availability. When buyers expect prices to rise, many rush to lock in volume early, which often pushes out supplier lead times. If you pick a few raw materials that make up a large share of your costs and track their price trends consistently, procurement can make better calls on forward buying or staggered purchases, and demand planning can discuss inventory targets on the same basis.
Unusually severe heat waves, cold snaps, or prolonged rainy seasons can cause big swings in demand for weather-sensitive products like beverages, ice cream, and seasonal appliances. For food companies that rely on agricultural or seafood inputs, crop yields and catch volumes feed directly into raw material supply and pricing. Because weather signals act on demand and supply at the same time, they deserve a closer look than other external signals.
For regulations announced ahead of their effective dates, such as tariff changes or new import and export rules, reviewing the affected SKUs and suppliers in advance can spare you from having to scramble on volumes right before the rules take effect.
One caution when tracking external signals: watching more indicators doesn't necessarily make it easier to make the right call. In practice, most teams pick two or three indicators with the biggest impact on their costs and lead times and monitor those consistently. Which indicators matter will vary by industry and sourcing structure.
Once you've spotted a signal, you need to decide which decisions to adjust because of it. Treat every signal with equal urgency and your team will burn out fast. Just collect signals without acting on them and you'll likely only recognize the problem after a stockout or overstock has already hit. Here are three steps for connecting signals to real decisions.
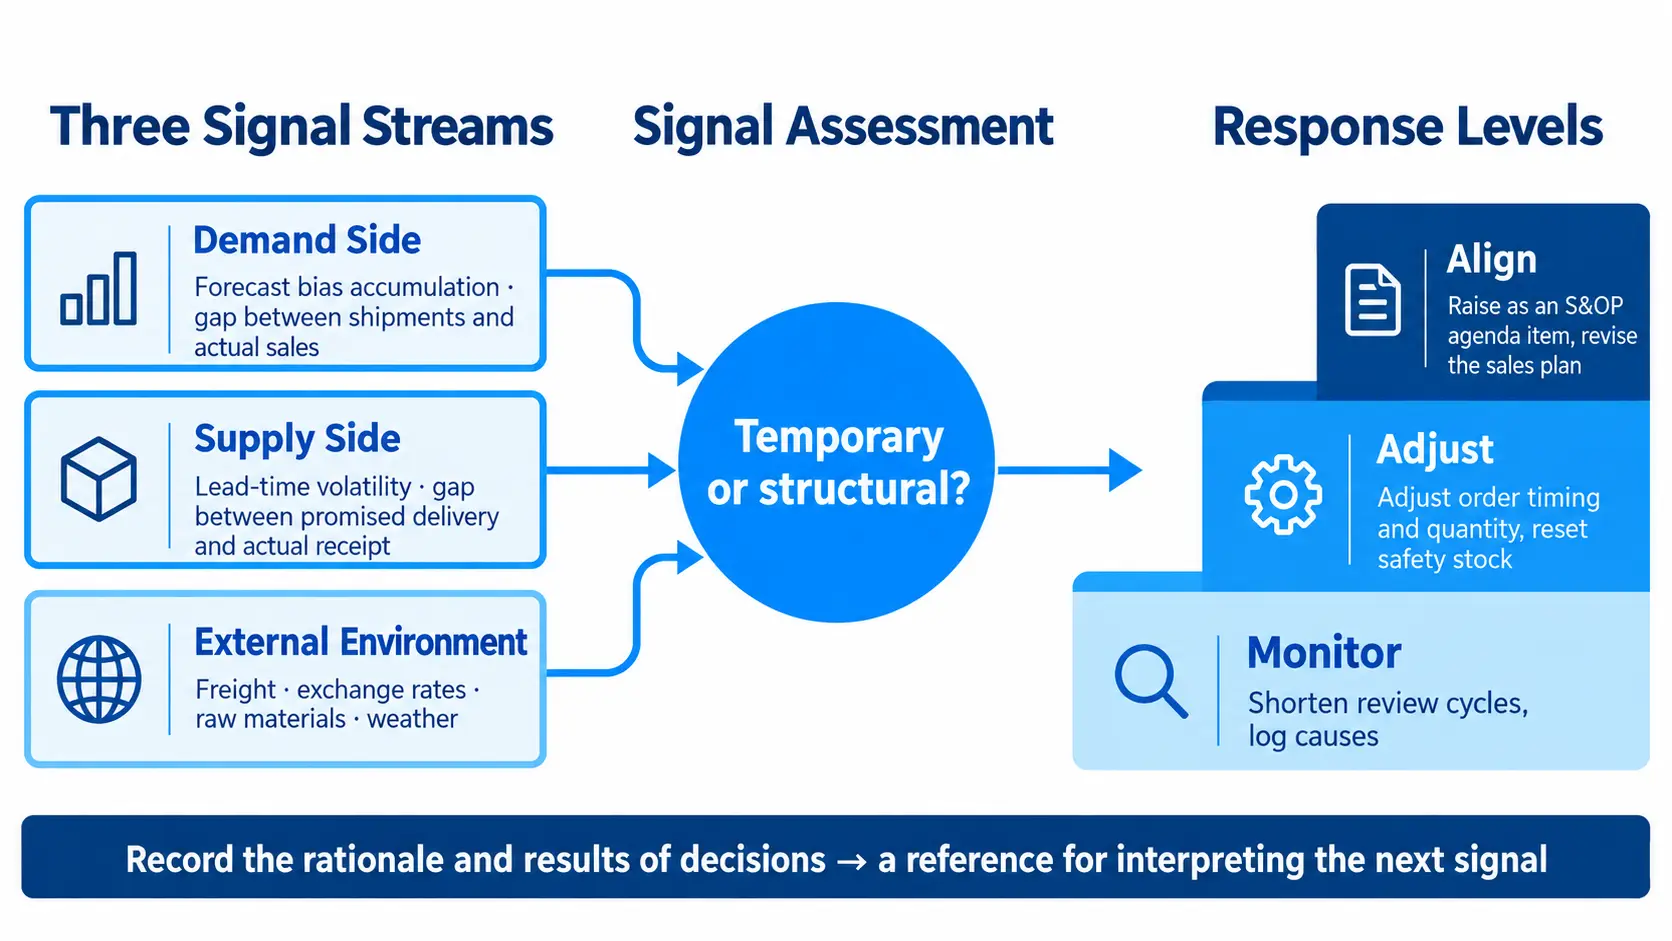
When you first spot a signal, start by calmly looking into the cause. Ask yourself the following questions.
Has the same change persisted for several months?
If a short-term change lasting about a month was driven by something specific like a promotion or a stock shortage, you can treat it as temporary. If it's something that directly hits sales, like a stockout, your first moves should be additional receipts, expedited orders, or transferring stock from another warehouse.
Then record how the situation affected your actuals and keep that note separate, so the same cause doesn't distort your next forecast. On the other hand, if the change continues well beyond a month or two, or spreads to multiple SKUs, it's better to treat it as a structural shift and prepare for the next level of response.
Defining response levels in advance makes it much easier to know who needs to make which decision, and how fast, when a signal actually appears. The table below is only an example. Real-world thresholds will depend on each company's margin structure and inventory policy.
One of the key criteria used at the Adjust level is inventory coverage. Inventory coverage shows how long current inventory can cover expected demand going forward.
If coverage drops below lead time, inventory could run out before a new order even arrives. In that case, you'd look at pulling orders forward or transferring stock from another location. When the demand increase signals and lead time increase signals covered earlier appear at the same time, coverage shrinks while the time you need to cover grows. In situations like this, setting things up so you can compare both signals on one screen makes for much faster decisions.
Recording what decision you made in response to a signal, why you made it, and how inventory moved as a result gives you a reference point for interpreting the next signal. Say you have a record from last year showing that pulling orders forward a few weeks during a similar freight rate spike got you through without a stockout. When the same signal shows up this year, you can jump straight into the discussion without rebuilding the rationale from scratch.
On the data side, the foundation includes SKU-level shipment history, past forecast history, PO dates and original promise dates, actual receipt dates, and notes on the causes of abnormal actuals. Of these, past forecasts and original promise dates are hard to reconstruct after the fact if you haven't been recording them, so start capturing those first.
On cost and complexity, consider phasing in gradually, starting with the top product groups where stockouts and excess inventory have the biggest impact, rather than trying to cover every SKU and every signal from day one. Also keep in mind that overly sensitive thresholds will generate too many alerts, and planners will start ignoring them altogether. In the early months, review whether alerts actually led to real problems and fine-tune your thresholds over time.
You can measure results through changes in metrics such as stockout rate, days of inventory, and SKU-level forecast error. Which metrics to prioritize depends on whether your company puts more weight on cutting inventory costs or capturing sales opportunities.
When you're checking all of these signals across separate spreadsheets and trading emails between departments, pulling the signals together eats up so much time that there's little left for the decisions that actually matter.
With that day-to-day workflow in mind, ImpactiveAI completely revamped its AI demand forecasting solution, Deepflow Forecast, in October 2026. The new Deepflow Forecast gives you a single view of demand shifts and inventory risk, and it's designed so you can review forecasts and move straight into ordering and inventory decisions or S&OP discussions.
Deepflow works alongside your existing ERP and other planning systems, so you can start with the work that delivers immediate value, such as demand forecasting and inventory risk review. You can also roll it out first on your highest-impact product groups and see the results for yourself.
ImpactiveAI delivers forecasting systems tailored to each company's data environment, built on more than 224 forecasting models and 80 patents. One food company that adopted Deepflow cut its inventory risk by more than 26%.
I
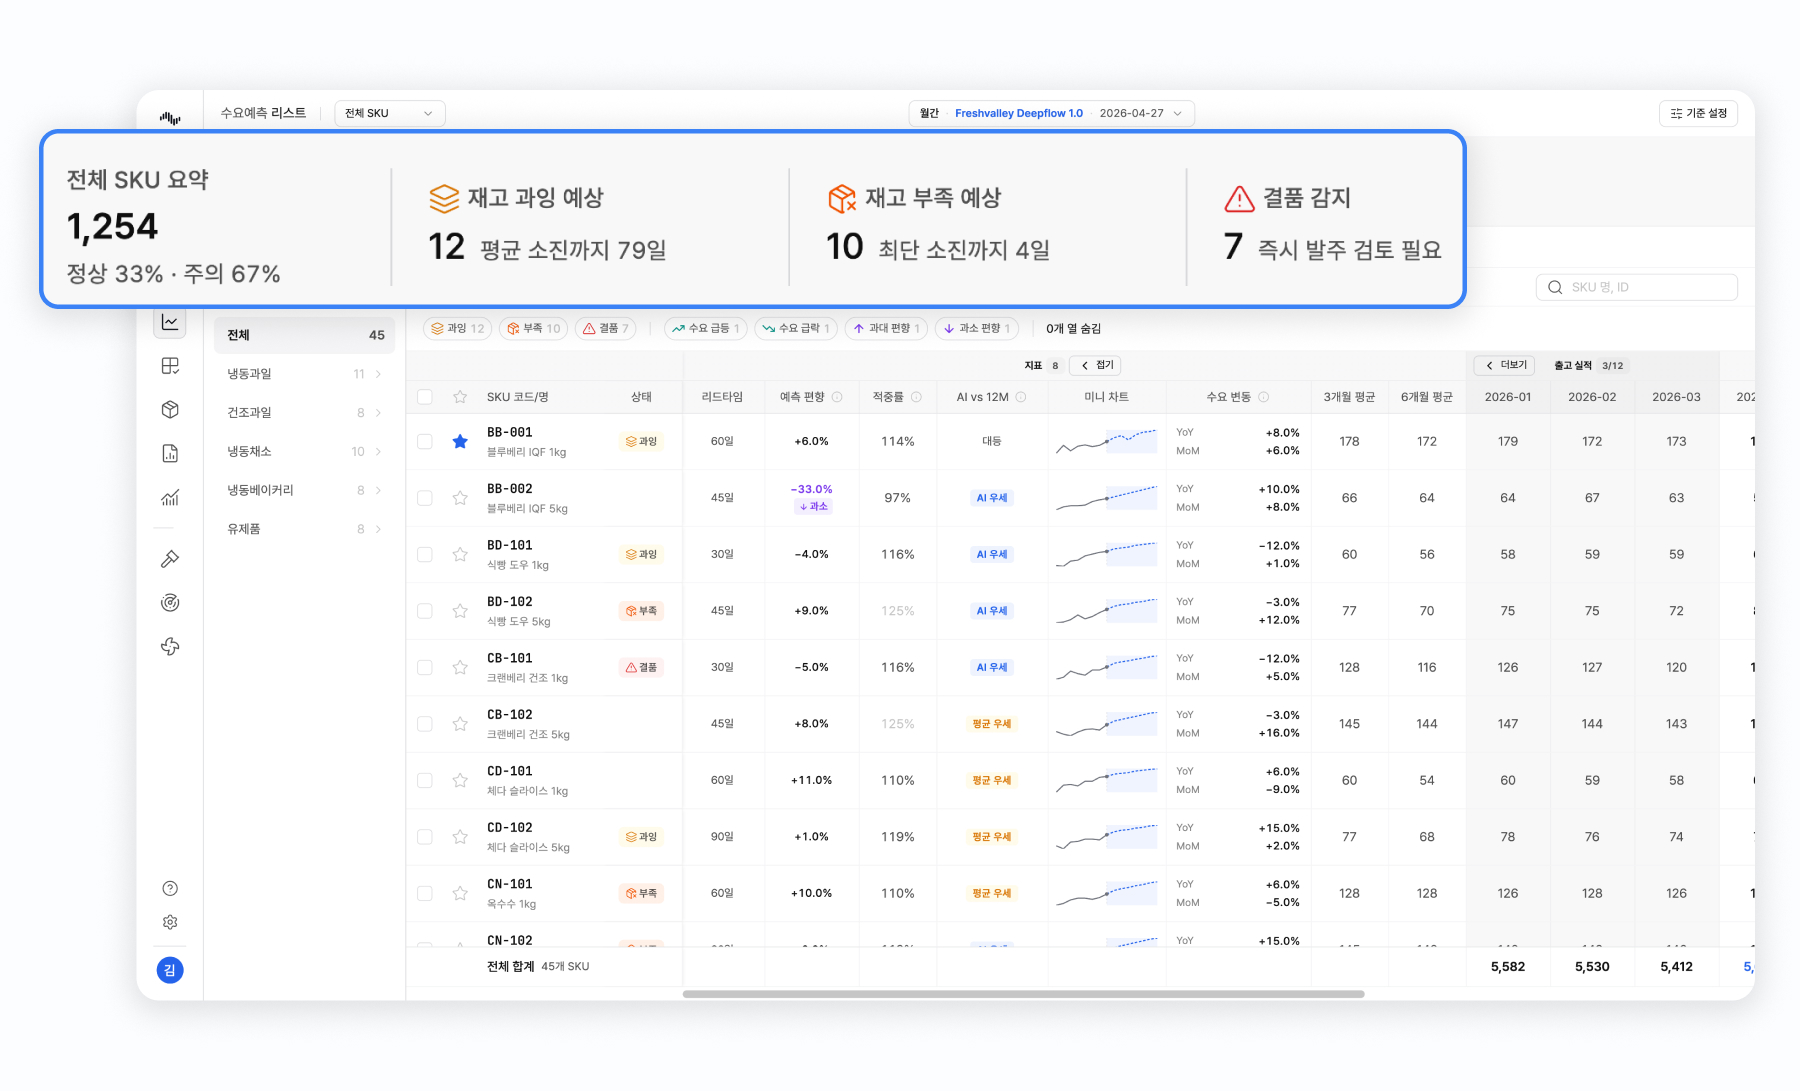
When you log in to Deepflow Forecast, you see each SKU's inventory status classified at a glance as normal, short, overstocked, or out of stock. SKUs with sudden demand spikes or drops compared to the previous month or the same period last year are flagged separately so you can spot them right away. Instead of opening forecast charts for thousands of SKUs one by one, you can go straight to the items showing the demand signals you've predefined. Planners can then focus their time on whether a flagged change is temporary or needs further action.
The inventory coverage described in Step 2 is calculated against each SKU's actual lead time. That means planners can judge on the spot whether current inventory will cover expected demand until the next receipt arrives.
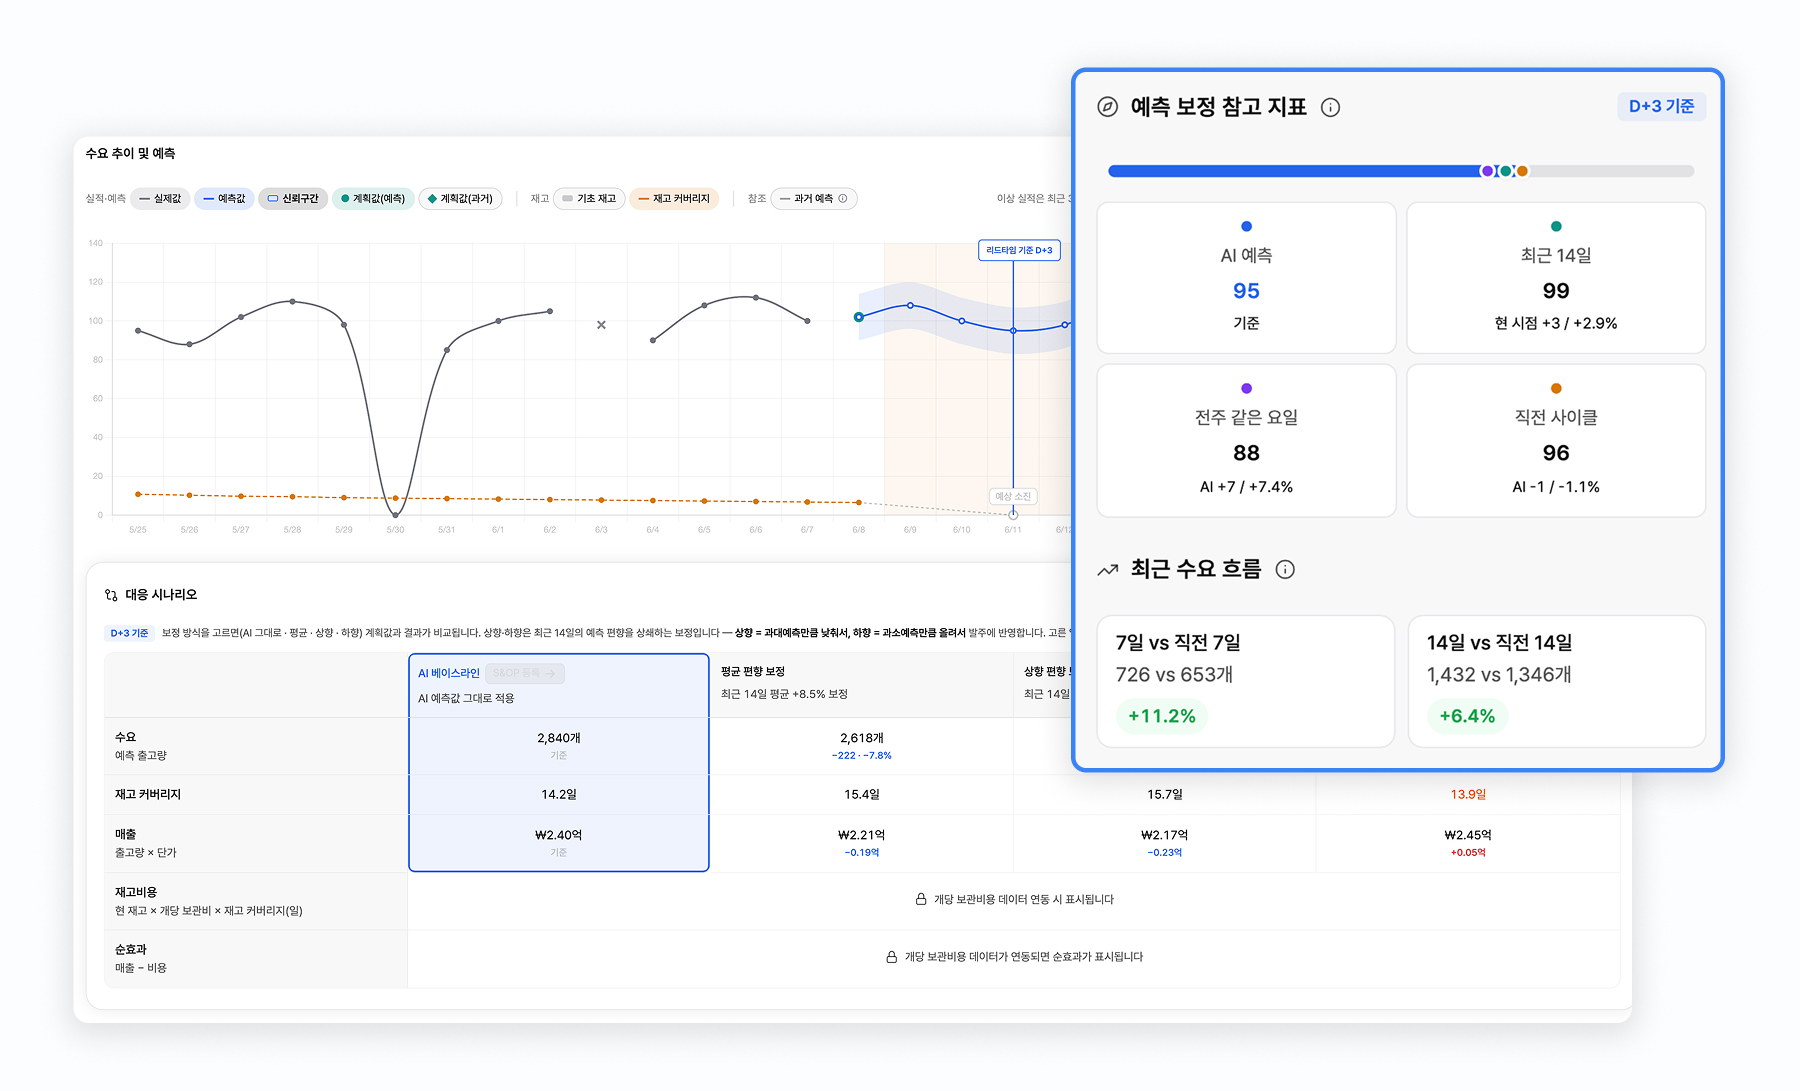
Deepflow Forecast lets you compare AI forecasts side by side with recent demand trends. For monthly forecasts, for example, the AI forecast sits next to the 3-month average, the same month last year, and the previous cycle's actuals. That makes it easy to see at a glance how far this forecast deviates from the norm.
You can also see whether specific SKUs keep getting over- or under-forecast. That bias can be an important input when choosing among the response scenarios described below.
Causes that are hard to see in the numbers alone, such as stockouts or one-off promotions, are logged in the Abnormal Actuals Management screen. Over time, that history is used to make the forecasting models more precise.
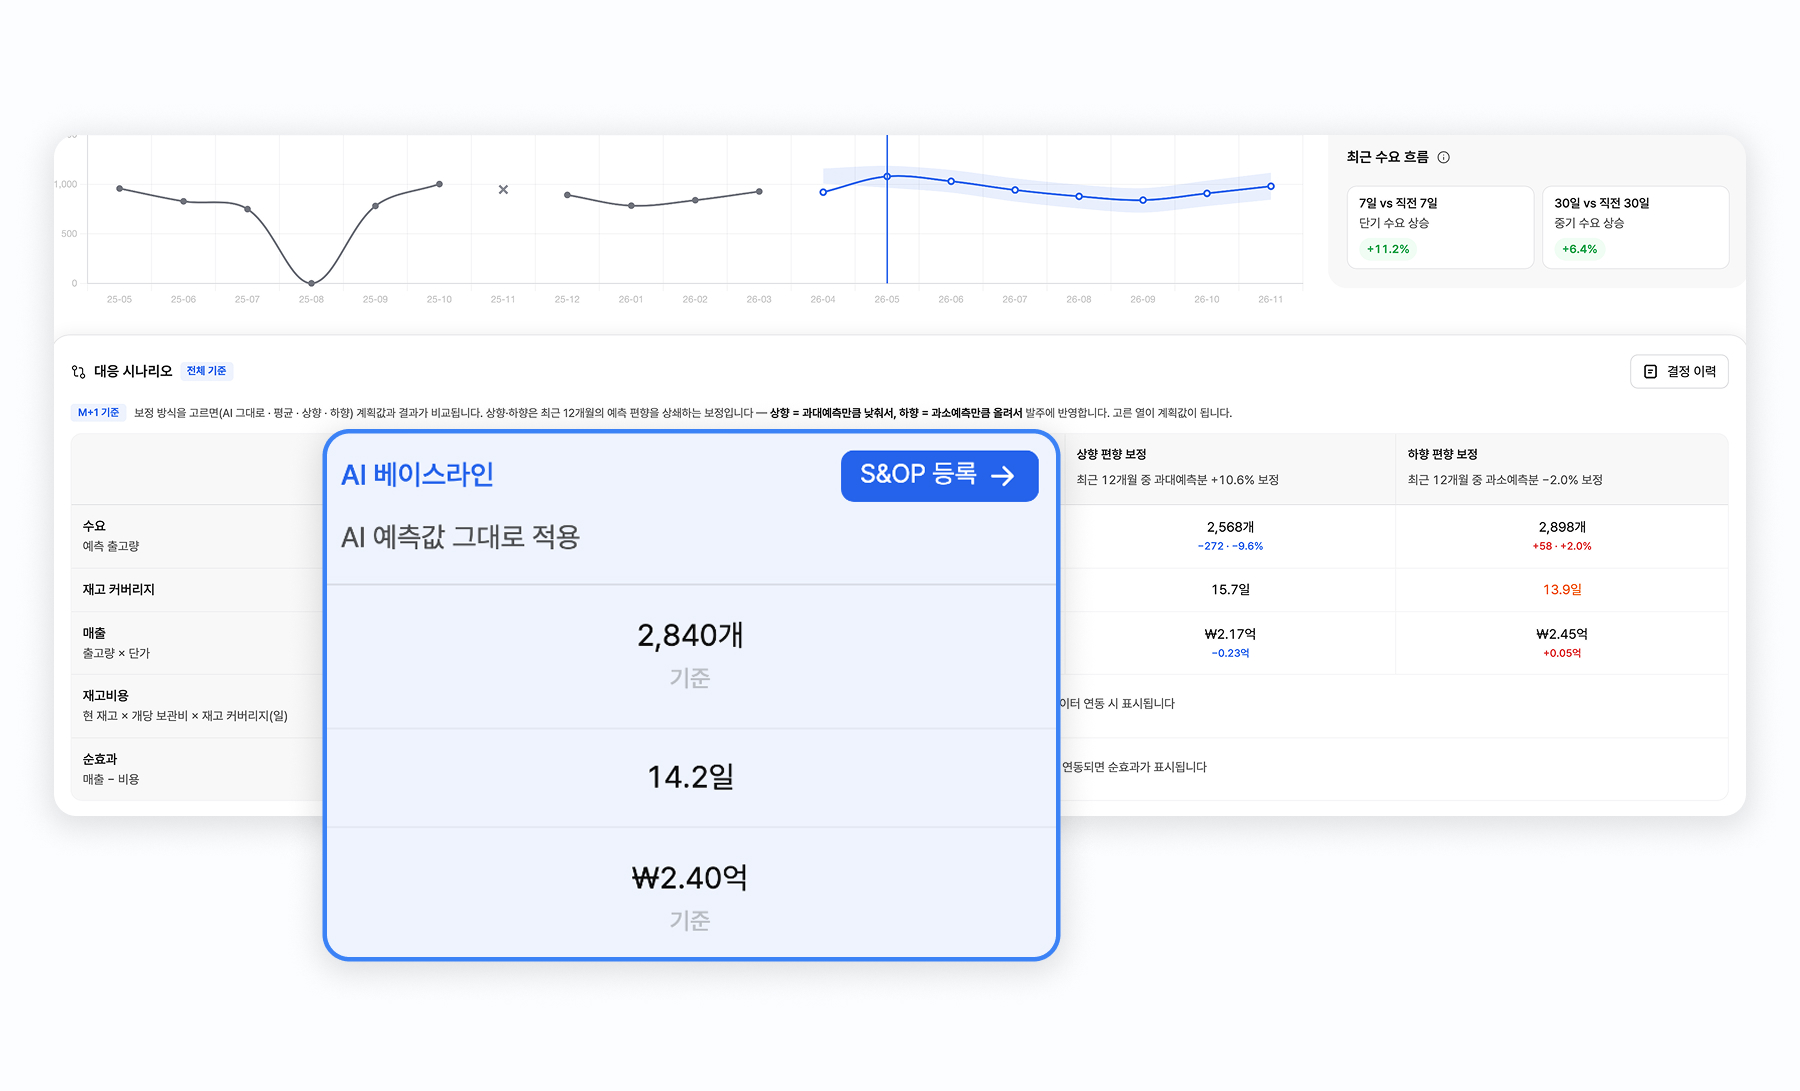
Deepflow Forecast includes a screen that lets you compare scenarios side by side based on past forecast error and bias: ordering at the AI's baseline forecast, taking a conservative approach to cut excess inventory, or ordering more to guard against stockouts. Rather than handing you a single right answer, the AI helps planners pick the scenario that fits the company's strategy and make the actual call.
When teams disagree, you can also use the S&OP integration. Say the AI forecasts demand for a product at 13,000 units, but sales believes it needs up to 20,000 because of an upcoming home shopping campaign. Each number and its rationale can be entered side by side, compared and reviewed during the S&OP process, and the final decision and reasoning recorded in the system. Issues and decisions that used to be scattered across department spreadsheets and email threads end up in one place, so the decision rationale discussed in Step 3 builds up naturally.
Go through the questions below one by one to see where you're already catching signals and where you have gaps.
No one can prevent every risk perfectly all at once. But if you keep repeating the cycle of separating temporary causes from structural ones, matching your response to the strength of the signal, and documenting your reasoning, you'll start catching early signs of stockouts and excess inventory much sooner than before.
If you're wondering how to apply this approach to the SKUs you manage today, take a look at Deepflow Forecast's forecasts and inventory risk view for yourself.