.svg)

.svg)
%202.svg)
Designing a Demand Forecasting KPI Framework for Supply Chain Optimization

In modern supply chain management, accurately measuring and managing demand forecasting performance has transcended operational efficiency to become core to strategic competitive advantage. Particularly under diversified market conditions and complex global supply chains, traditional single-metric performance measurement has clear limitations.
The central challenge facing demand forecasting experts is bridging the gap between forecast accuracy and business impact. In a reality where high forecast accuracy doesn't necessarily translate to superior financial performance, building a multi-layered, integrated KPI framework has become essential.
Hierarchical KPI Architecture and Measurement Methodologies
Advancing Forecast Accuracy Metrics

Traditional MAPE (Mean Absolute Percentage Error) and MAD (Mean Absolute Deviation) remain important but have limitations in reflecting business context. Advanced forecast accuracy measurement requires weighted accuracy metrics.
Value-Weighted MAPE differentially weights forecast errors by product according to revenue contribution. This accurately reflects how high-revenue product forecast errors impact overall performance.
Formula: VWMAPE = Σ(|Actual - Forecast| × Revenue Weight) / Σ(Actual × Revenue Weight) × 100
Skill Score evaluation against baseline models also matters. Rather than absolute accuracy alone, measuring improvement versus naive forecasts or market averages evaluates the predictive model's actual value. Stratified accuracy measurement by SKU complexity is also necessary. Apply different accuracy standards for fast-moving, slow-moving, and intermittent demand product groups, constructing integrated metrics reflecting each category's business importance.
Forecast Bias and Stability Indicators
Forecast bias analysis through Mean Percentage Error (MPE) is central to identifying systematic under/over-forecasting patterns. Persistent bias can lead to inventory excess or stockouts, causing substantial costs.
Forecast Value Added (FVA) measurement evaluates whether each forecasting process stage actually creates value. Comparing statistical forecasts versus adjusted forecasts and performance before and after market intelligence incorporation quantifies the effectiveness of human intervention. Prediction Interval Coverage for uncertainty quantification matters too. Beyond simple point forecasts, measure actual hit rates for 95% confidence intervals to evaluate predictive model reliability.
Business Impact-Centered Operational KPIs
Integrated Inventory Efficiency and Service Level Metrics

Inventory Efficiency Ratio is a composite metric measuring service level achievement relative to inventory investment. Rather than evaluating inventory turnover or service levels individually, finding the optimal balance between these metrics is key.
Formula: IER = (Service Level Achievement Rate × Customer Value Weight) / (Inventory Investment / Revenue)
Days of Supply (DOS) Variability measurement for inventory stability is needed. Evaluate supply chain stability by considering not just average inventory levels but inventory volatility together. Differentiated KPI setting using ABC-XYZ analysis should apply different target service levels and inventory efficiency standards across nine categories based on revenue contribution (ABC) and demand volatility (XYZ).
Supply Chain Agility and Resilience Indicators
Demand Signal Responsiveness measures the forecast system's reaction speed to actual demand changes. How quickly the system detects market changes and incorporates them into forecasts is a core capability for modern supply chains.
Supply Chain Risk Exposure should measure forecast-based risk management performance. Quantify the ability to proactively identify situations where forecast accuracy is expected to decline and establish response plans. Forecast Horizon Accuracy Decay analysis identifies accuracy reduction patterns by forecast period, enabling optimal forecast interval settings for different decision points.
KPI Optimization Using Advanced Analytics Techniques
Multivariate Performance Analysis and Causal Relationship Identification
Rather than individually optimizing single KPIs, balanced optimization of the entire KPI portfolio is needed. Pareto Frontier Analysis finds optimal balance points among conflicting objectives.
Causal Impact Analysis should quantify the causal influence of forecast improvement activities on actual business performance. This measures real improvement effects beyond simple correlation. Sensitivity Analysis simulates how changes in each KPI's target level affect overall supply chain performance, determining resource allocation priorities.
Dynamic KPI Adjustment and Adaptive Management
An Adaptive KPI Framework that dynamically adjusts KPI weights and target levels according to changing market conditions and business situations is necessary. Apply differentiated performance standards based on seasonality, market volatility, and product lifecycle stages.
Control Charts and Statistical Process Control techniques for forecasting process quality management also matter. Setting normal variation ranges for forecast accuracy and detecting anomalous signals early enables rapid responses for process improvement. Rolling Window Analysis is a methodology that analyzes temporal trends in KPI performance and evaluates the sustainability of performance declines or improvements.
If You Need Demand Forecasting KPI Framework Establishment and Accuracy Measurement
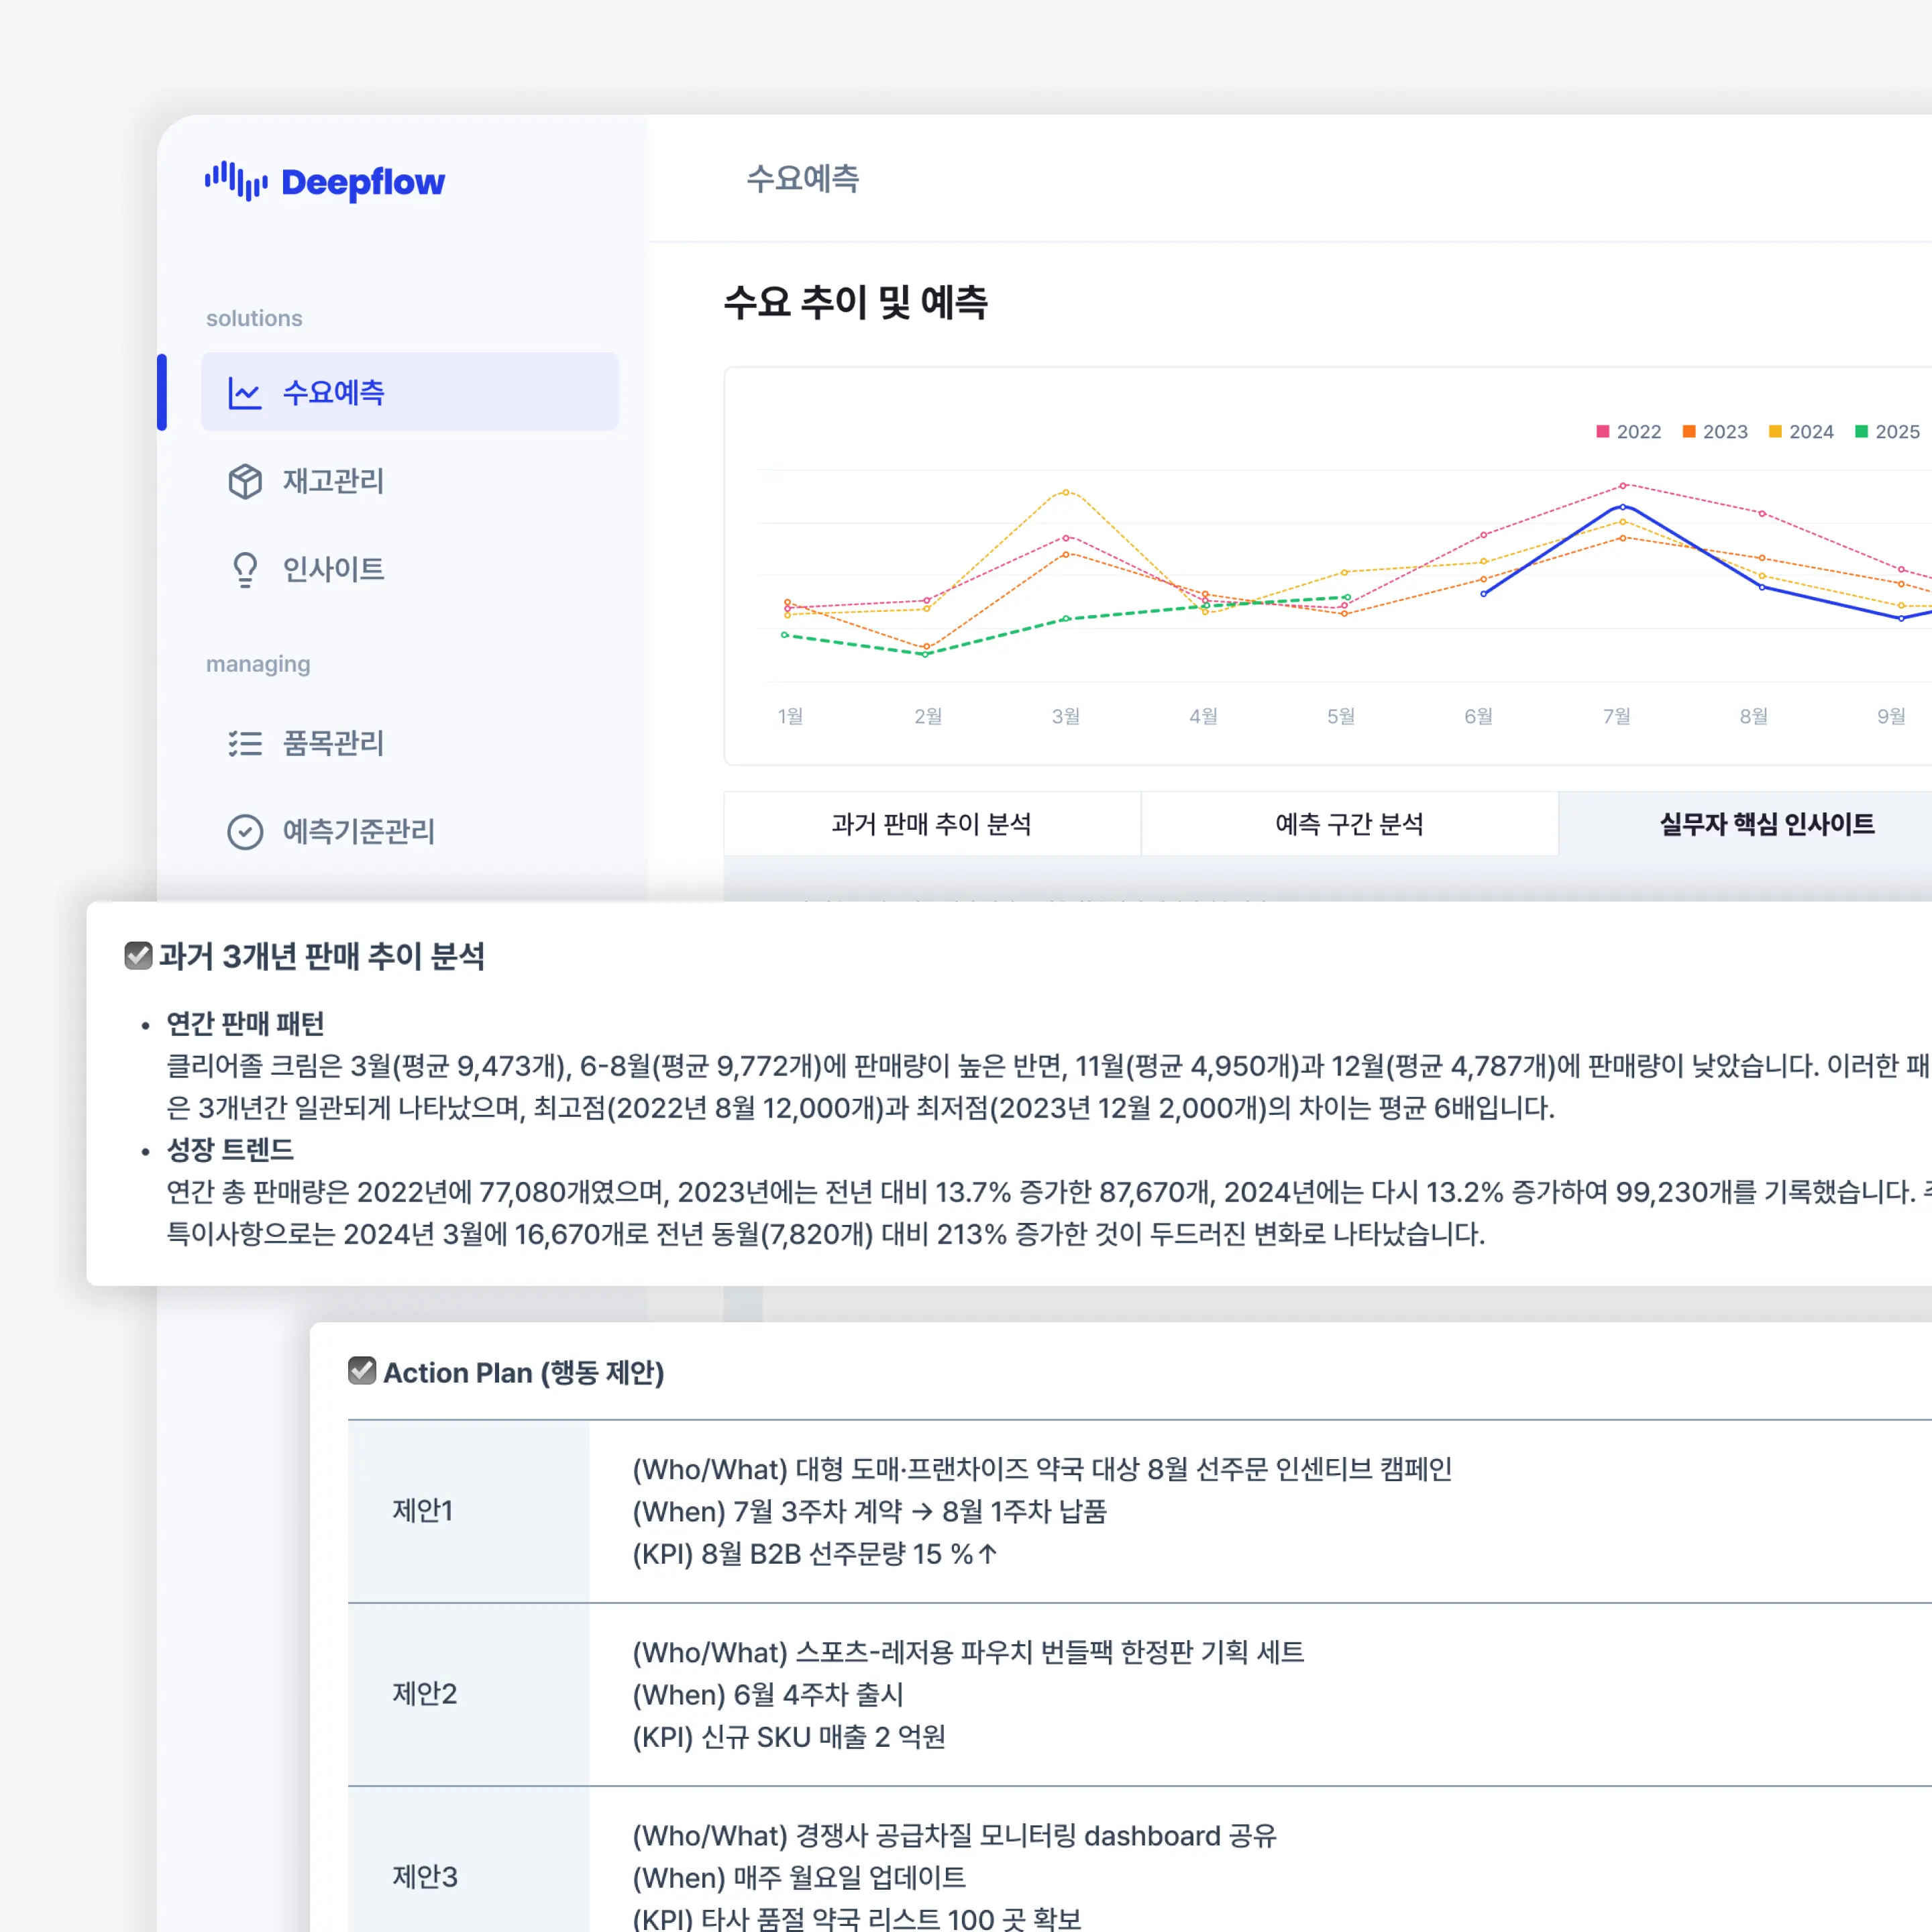
Effectively managing complex, multi-layered KPI frameworks requires sophisticated analytics platforms and automated monitoring systems. Particularly in environments where 224 predictive models compete to select optimal models, comparing performance by model and analyzing KPI contribution becomes highly complex work.
ImpactiveAI's Deepflow solution provides an integrated approach that effectively manages this complexity. Through models customized to SKU-specific sales and shipment patterns, it achieves forecast accuracy up to 98.6% while simultaneously supporting integrated management of days on hand through base inventory integration.
Deepflow's Business Intelligence dashboard particularly provides highlights for products expected to face shortages or excess, connecting operational KPIs with forecast KPIs in real-time. This goes beyond simple forecast accuracy measurement to enable direct monitoring of actual business impact.
Deepflow is utilized across various operational departments including Sales, Purchasing, Marketing, and SCM, highlighting inventory issue products in advance and supporting S&OP decision-making. This enables departmental operational efficiency improvements and integrated supply chain management.
Future-Oriented KPI Evolution Directions
Demand forecasting KPI frameworks continue evolving with digital transformation and AI technology advances. Improved real-time data processing capabilities are enabling near real-time KPI monitoring, with machine learning-based automated anomaly detection and root cause analysis becoming commonplace.
As sustainable supply chain management from ESG (Environmental, Social, Governance) perspectives gains importance, new KPIs reflecting carbon footprint minimization and social responsibility fulfillment are emerging. Green Supply Chain KPIs quantifying forecast accuracy improvement's effects on environmental impact reduction are prime examples.
As customer-centric personalized services spread, microscopic KPIs linked to individual customer satisfaction levels are becoming important alongside group-level forecast accuracy.
Successful demand forecasting KPI frameworks for supply chain optimization must evolve beyond simple performance measurement tools into strategic assets that promote organizational learning and innovation while creating sustained competitive advantage. This requires an integrated approach that balances technical sophistication with business insight.
.svg)


.svg)