.svg)

.svg)
%202.svg)
What Are Profit and Loss-Based Metrics from a Business Perspective?

Why P&L-Based Metrics Matter
Demand forecasting is the cornerstone of Sales and Operations Planning (S&OP) and fundamentally drives resource allocation across enterprise operations, including inventory management, production planning, and purchasing decisions. Despite this critical role, many companies still rely on statistical error metrics such as MSE (Mean Squared Error) and MAPE (Mean Absolute Percentage Error) to evaluate forecast model performance.
These traditional metrics only measure the symmetrical 'distance' between predicted and actual values, completely failing to reflect the asymmetry of business costs resulting from forecast errors. In real business environments, the inventory holding costs from overforecasting 100 units are never equal to the lost sales costs from underforecasting 100 units.
The ultimate value of a demand forecasting SaaS solution lies not in statistical accuracy alone, but in optimizing tangible financial performance. Therefore, the training and evaluation of forecasting models must center on P&L-based loss functions that internalize a company's unique cost and revenue structure. This essential strategy transforms forecasting systems from simple 'prediction tools' into 'profit optimization engines.'
1. Understanding Loss Functions and Extending to P&L-Based Metrics
The loss function is a core concept in machine learning model training, serving to quantify the error between a model's predicted value (Y^\hat{Y}Y^) and the actual value (YYY). Model weights and biases are updated in the direction that minimizes this error.
The Role of General Loss Functions and Their Business Limitations
Loss functions measure error magnitude and guide model training through gradient descent and backpropagation. For regression problems, MSE and MAE are commonly used.
However, while these general loss functions are useful for improving statistical accuracy, they have a critical limitation in that they cannot distinguish between different types of business costs. In actual decision-making, the 'financial impact of errors' matters far more than the 'magnitude of errors' themselves. For example, if a 10% overforecast generates $100 in costs while a 10% underforecast generates $1,000 in costs, the model should weight the latter error more heavily during training.
Transitioning to Business P&L-Based Metrics
The P&L-based metrics that ImpactivAI advocates were created to solve this asymmetry problem. While building on commonly used regression model loss functions, these strategic metrics directly incorporate business cost weights that differ depending on whether the error represents overforecasting or underforecasting.
This approach shifts the model's optimization objective from simply improving numerical accuracy to focusing on minimizing the total expected cost that could actually occur in practice.
2. Core Principles of P&L-Based Metrics: Mathematical Formulation of Asymmetric Loss Functions
P&L-based metrics are built on asymmetric loss functions that mathematically implement the newsvendor problem, a cornerstone of inventory optimization theory. These functions aim to find the optimal order quantity, Y^∗\hat{Y}^*Y^∗, that minimizes expected loss.
Asymmetric Loss Function Definition and Cost Calculation

The loss function that considers profit and loss applies different unit costs based on how the forecast differs from actual demand and in which direction. Overforecasting incurs a cost of CoC_oCo, while underforecasting incurs a cost of CuC_uCu. Here, YYY represents actual demand and Y^\hat{Y}Y^ represents the forecasted order quantity.
The total loss function L(Y^,Y)L(\hat{Y}, Y)L(Y^,Y) can be expressed as follows:
L(Y^,Y)={Co⋅(Y^−Y)ifY^≥Y(overforecast)Cu⋅(Y−Y^)ifY^<Y(underforecast)L(\hat{Y}, Y) = \begin{cases} C_o \cdot (\hat{Y} - Y) & \text{if } \hat{Y} \ge Y \quad \text{(overforecast)} \\ C_u \cdot (Y - \hat{Y}) & \text{if } \hat{Y} < Y \quad \text{(underforecast)} \end{cases}L(Y^,Y)={Co⋅(Y^−Y)Cu⋅(Y−Y^)ifY^≥Y(overforecast)ifY^<Y(underforecast)
In other words, when the forecast exceeds actual demand, the cost associated with overforecasting is calculated, and conversely, when it falls short, the cost of underforecasting is calculated. This approach more accurately reflects realistic losses based on the direction of the error.
Critical Ratio and Optimal Order Quantity Calculation
The optimal order quantity Y^∗\hat{Y}^*Y^∗ that minimizes the total expected loss E[L]E[L]E[L] is determined by the quantile of the demand distribution corresponding to the Critical Ratio (CR).
P(Y≤Y^∗)=CuCo+CuP(Y \leq \hat{Y}^*) = \frac{C_u}{C_o + C_u}P(Y≤Y^∗)=Co+CuCu
The Critical Ratio (CR) serves as a benchmark showing how much more costly stockouts are compared to excess inventory. The higher the CR (closer to 1), the more problematic stockouts are compared to unsold inventory, so the optimal order quantity increases accordingly.
Therefore, in actual operations, rather than simply setting order quantities based on average demand alone, it's more practical to use CR to establish safety stock levels that reflect risks and specific circumstances.
3. Practical Quantification of P&L-Based Metrics: Core Cost (Co,CuC_o, C_uCo,Cu) Analysis
The success of P&L-based metrics depends on how accurately and realistically the core cost parameters CoC_oCo and CuC_uCu are quantified. Close collaboration with finance, sales, and logistics departments is essential.
CoC_oCo: Per-Unit Inventory Holding and Obsolescence Cost
CoC_oCo represents the total cost incurred when holding one unit of product as inventory for a specific period.
Capital cost refers to the opportunity cost of capital tied up in inventory, calculated as product cost multiplied by the required rate of return. Storage and handling costs include warehouse rent, insurance, utilities, and labor costs for inventory movement and handling, converted to a per-unit basis. Obsolescence and depreciation costs account for value deterioration and disposal costs due to expiration dates, trend changes, and similar factors. This component typically represents the largest proportion for high-risk items such as new products, fashion, and IT goods.
As a quantification guideline, CoC_oCo is generally estimated at 15% to 35% of Cost of Goods Sold (COGS), though high-risk items can significantly exceed the upper limit.
CuC_uCu: Per-Unit Underforecasting and Stockout Cost
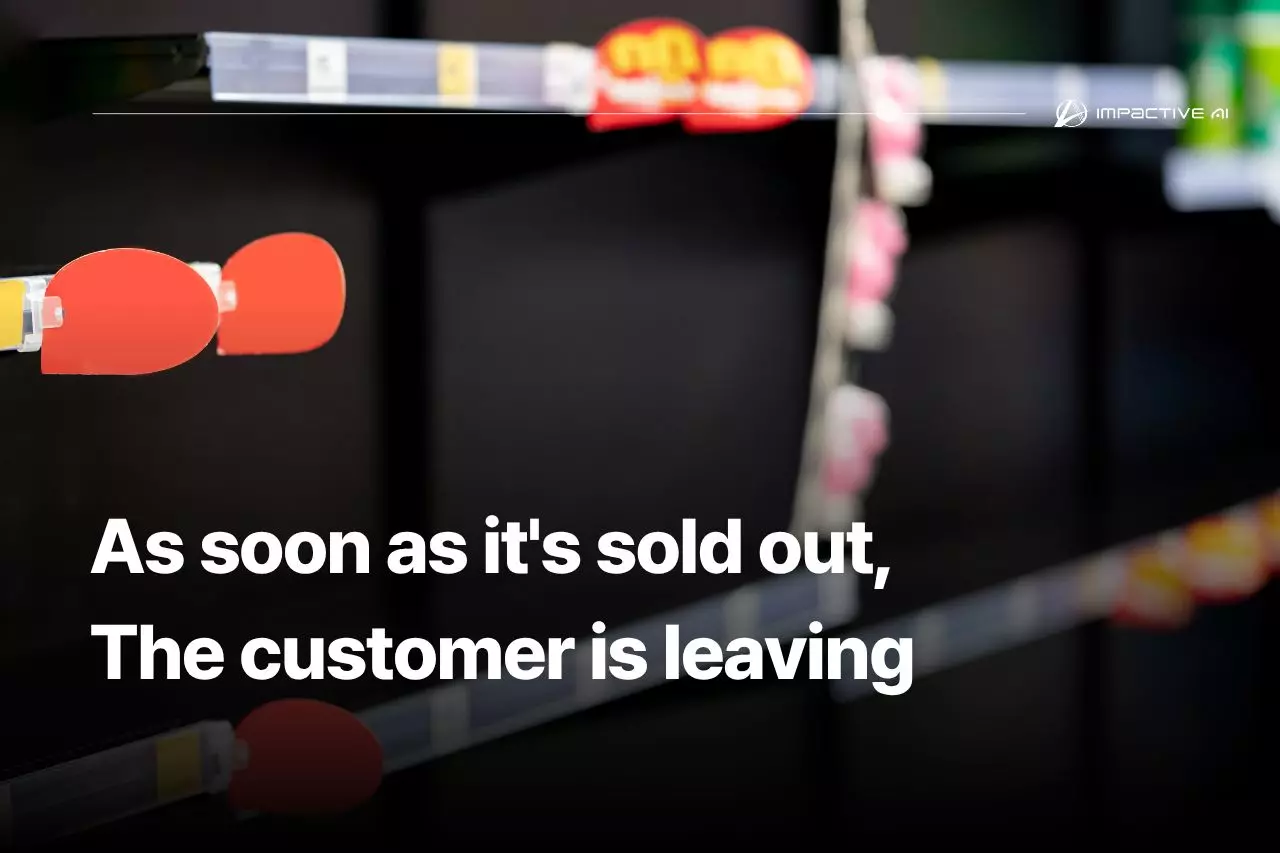
CuC_uCu represents the cost incurred when sales opportunities are lost due to inventory shortages despite existing demand. While difficult to quantify, precise estimation is essential because it has the greatest impact on business performance.
Lost sales represent the immediate loss of sales margin due to stockouts, calculated as selling price minus product cost. Backorder and expedited costs include additional management costs when customers wait without canceling orders, plus expedited shipping costs to resolve stockouts.
Hidden costs encompass customer churn costs, which reflect the present value of future revenue loss (a portion of Customer Lifetime Value) when customers defect after experiencing stockouts, as well as brand image damage costs representing potential sales impact from declining market reputation.
As a quantification guideline, CuC_uCu is typically set at 5 to 20 times or more than CoC_oCo. To ensure the model recognizes stockouts as a serious risk, a common strategy involves setting CuC_uCu higher than the per-unit margin during training.
4. Model Training and Practical Integration Strategy for P&L-Based Metrics
P&L-based metrics must be directly integrated into the model training process, not just model evaluation, to maximize practical performance.
Applying Asymmetric Loss Functions to ML/DL Models
When using models like deep learning or boosting, there's no need to stick exclusively to MSE. You can directly define a loss function L(Y^,Y)L(\hat{Y}, Y)L(Y^,Y) tailored to your desired characteristics and proceed with gradient descent using this function.
For example, if the loss needs to be asymmetric, you can use differentiable variations like Asymmetric Huber Loss or Quantile Loss, or apply them directly. This enables the model to converge not merely toward the mean of predicted values but toward the cost-optimal quantile that minimizes actual costs.
Quantile Forecasting for Uncertainty Integration
In practice, quantile forecasting that incorporates prediction uncertainty is essential, rather than predicting only a single value. The Critical Ratio (CR) clearly indicates the target service level, and the model is trained to predict the quantile corresponding to this CR.
For example, if CR is 0.9, the order quantity is set at the 90th percentile of the demand distribution to achieve the targeted 90% service level.
Parameter Calibration and Governance
The CoC_oCo and CuC_uCu parameters require periodic recalibration as market conditions change, including logistics costs, interest rates, and competitive intensity.
Simulation-based validation involves backtesting forecast results with various Co/CuC_o/C_uCo/Cu ratios and simulating how actual inventory and stockout costs fluctuate to derive the optimal cost ratio. Data governance is critical for metric reliability, ensuring that the data underlying cost calculations, including COGS, margins, and logistics operating costs, maintains accuracy and currency.
5. Strategic Decision-Making Enhancement Using P&L-Based Metrics
Companies that approach demand forecasting from a strategic perspective don't stop at improving forecast accuracy. They expand their scope to optimizing the entire value chain and strategically managing risk. In this process, profit-oriented metrics evolve beyond simple numbers into essential tools for making critical decisions.
Portfolio Optimization and Differentiated CR Settings by SKU
Applying the same Co/CuC_o/C_uCo/Cu ratio uniformly across all SKUs can lead to inefficient resource allocation. In practice, experts treat each item as part of a portfolio and apply differentiated approaches based on P&L metrics.
Consider this example of differentiated CR (Critical Ratio) settings based on A-B-C analysis:
For Grade A items, which are core products with high margins, the risk of stockouts is extremely high. For these products, CuC_uCu is weighted heavily, and CR is set high at 0.95 or above to maintain the maximum service level.
Conversely, for Grade C items with low margins and high obsolescence risk, inventory holding costs can easily erode profits. In such cases, CoC_oCo is weighted more heavily and CR is set lower, between 0.55 and 0.65. This approach essentially implements an 'inventory minimization' strategy.
Dynamic Cost Modeling and Constraint Integration
Static Co/CuC_o/C_uCo/Cu ratios alone cannot adequately reflect market changes and dynamics. To calculate actual order quantities, dynamic modeling that responds flexibly to circumstances is essential.
For example, during specific periods such as promotions or season-end clearance, time-dependent or situation-dependent weights (multiplication factors) should be applied to CoC_oCo or CuC_uCu to enable sensitive model response. In practice, during promotional periods, the CuC_uCu value is often set at approximately double its normal level to respond flexibly to demand fluctuations.
Furthermore, to make predicted order quantities realistically executable, various constraints such as warehouse capacity, lead time variability, and minimum order quantities (MOQ) must be considered simultaneously. To achieve this, techniques such as Lagrange multipliers or convex optimization are employed in the loss function-based optimization process. This approach transforms forecasted order quantities into immediately actionable order quantities, forming the core of sophisticated ordering strategies.
Organizational Governance and Financial KPI Alignment
P&L-based metrics should become the common decision-making language across S&OP and finance organizations.
Synchronization with the finance department requires aligning the rationale for CoC_oCo and CuC_uCu calculations with the finance department's capital cost and margin analysis. Based on these metrics, establish key KPIs such as inventory turnover and total cost minimization rates, and directly link them with CR-based forecast accuracy to transparently translate performance.
For establishing S&OP decision-making criteria, formalize P&L-based metrics as the core decision-making standard in the S&OP process to resolve traditional conflicts between sales departments (concerned about underforecasting) and production departments (concerned about overforecasting) under the single objective of 'minimizing total expected loss,' thereby creating inter-organizational synergy.
Conclusion: Evolution Toward a P&L-Based Decision-Making System
Implementing demand forecasting solutions has now moved beyond simply obtaining 'more accurate forecasts.' The future direction involves building 'strategic decision-making systems that generate maximum profit with minimum cost.'
Deepflow precisely reflects each client's unique cost structure in its loss functions. This enables calculation of optimal inventory levels based on company-specific critical ratios, ensuring that forecast results naturally translate into actual financial performance.
By leveraging P&L-based metrics with precision, companies can manage risk from a cost perspective even under uncertain conditions. Simultaneously, they can maximize capital efficiency and contribute to achieving organization-wide strategic objectives. We hope that through your careful judgment and application, these sophisticated metrics will translate into tangible performance outcomes.
.svg)


.svg)