.svg)

.svg)
%202.svg)
%201.svg)
How Franchise Demand Forecasting Optimizes Store-Level Supply Chains
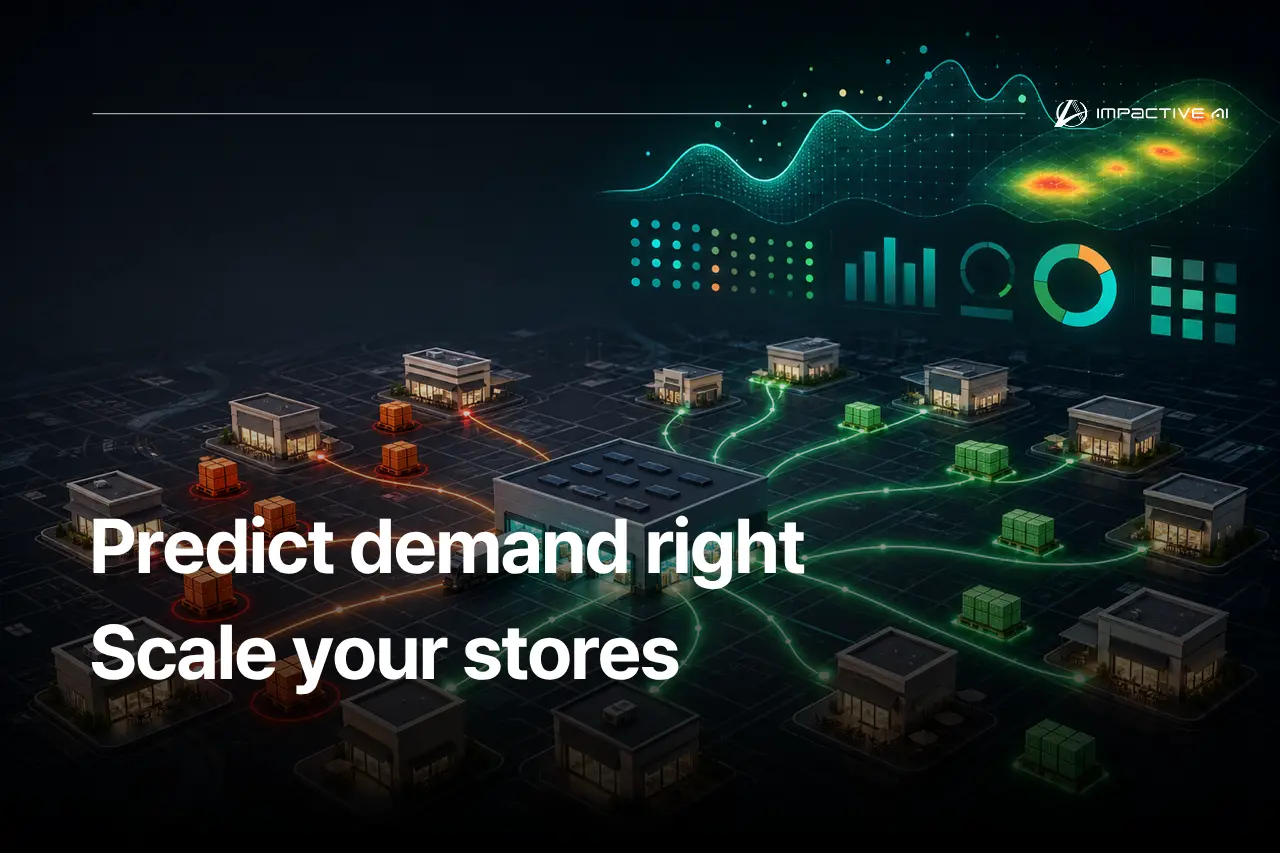
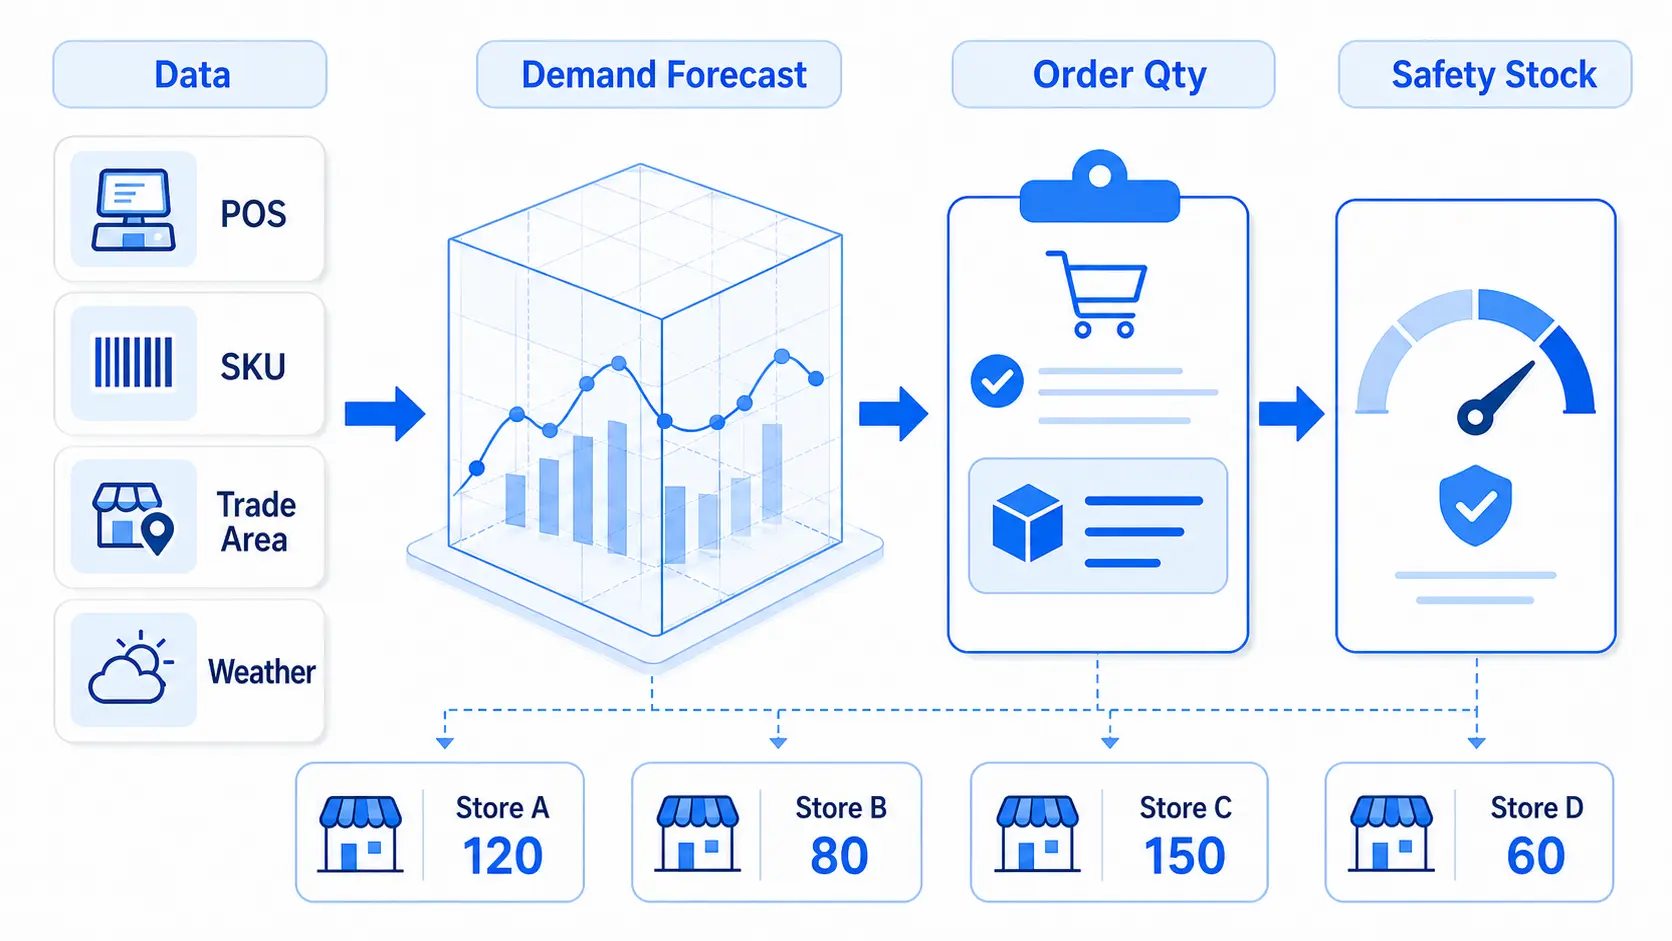
Franchise demand forecasting isn't about hitting the average across every store. It's about forecasting the next period of demand for each store — with its own trade area, floor size, SKU mix, operating hours, and delivery share — and then using that number as the basis for order quantities, safety stock, production and logistics allocation, and S&OP.
Supply every store off an average and some run out before the lunch peak while others end up with product sitting in the fridge until it has to be thrown away. Store-level forecasting brings that difference into the supply plan, so you can bring down overstock and stockouts together.
Why store-level differences unsettle the supply plan
A franchise headquarters can run the same menu, the same brand, and the same promotion and still keep running into one problem: the volume each store needs is different. A 40-pyeong store in a downtown office district burns through certain SKUs fast on weekday lunches. An 18-pyeong store on a residential side street leans more on evenings, weekends, and delivery orders. A store near a transit hub is sensitive to weather and commuting flows, and a store in a cram-school district shifts its demand pattern around school breaks and exam weeks.
That gap isn't just a sales gap — it's a supply-planning gap. Headquarters needs a store-level demand number when it sets the initial volume, the distribution center needs one when it allocates to each store, and the demand planner needs one when adjusting the next ordering baseline. An average that ignores trade area and store size looks easier to manage on the surface, but in practice it creates stocked-out stores and overstocked stores at the same time.
Retail forecasting research points the same way: store-level forecasts feed directly into ordering and inventory decisions. Working from bakery-chain data, Huber and Stuckenschmidt showed that in store-level daily demand forecasting, calendar variables such as day of week, holidays, and special days weigh heavily on forecast accuracy. Apply that view at a franchise headquarters and store-level trade area, size, and time variables stop being background context and become inputs to order quantity and safety stock.
For Korean franchises, the problem grows with the store count. The Korea Fair Trade Commission reported that its 2025 written survey of the franchise sector covered 200 franchisors and 12,000 franchisees across 21 business categories. For a headquarters running several hundred stores, a single store's forecast error looks small on its own, but summed across the network it turns into inventory cost, waste cost, and rush-shipping cost.
When supply is based on average demand, stockouts and waste rise together
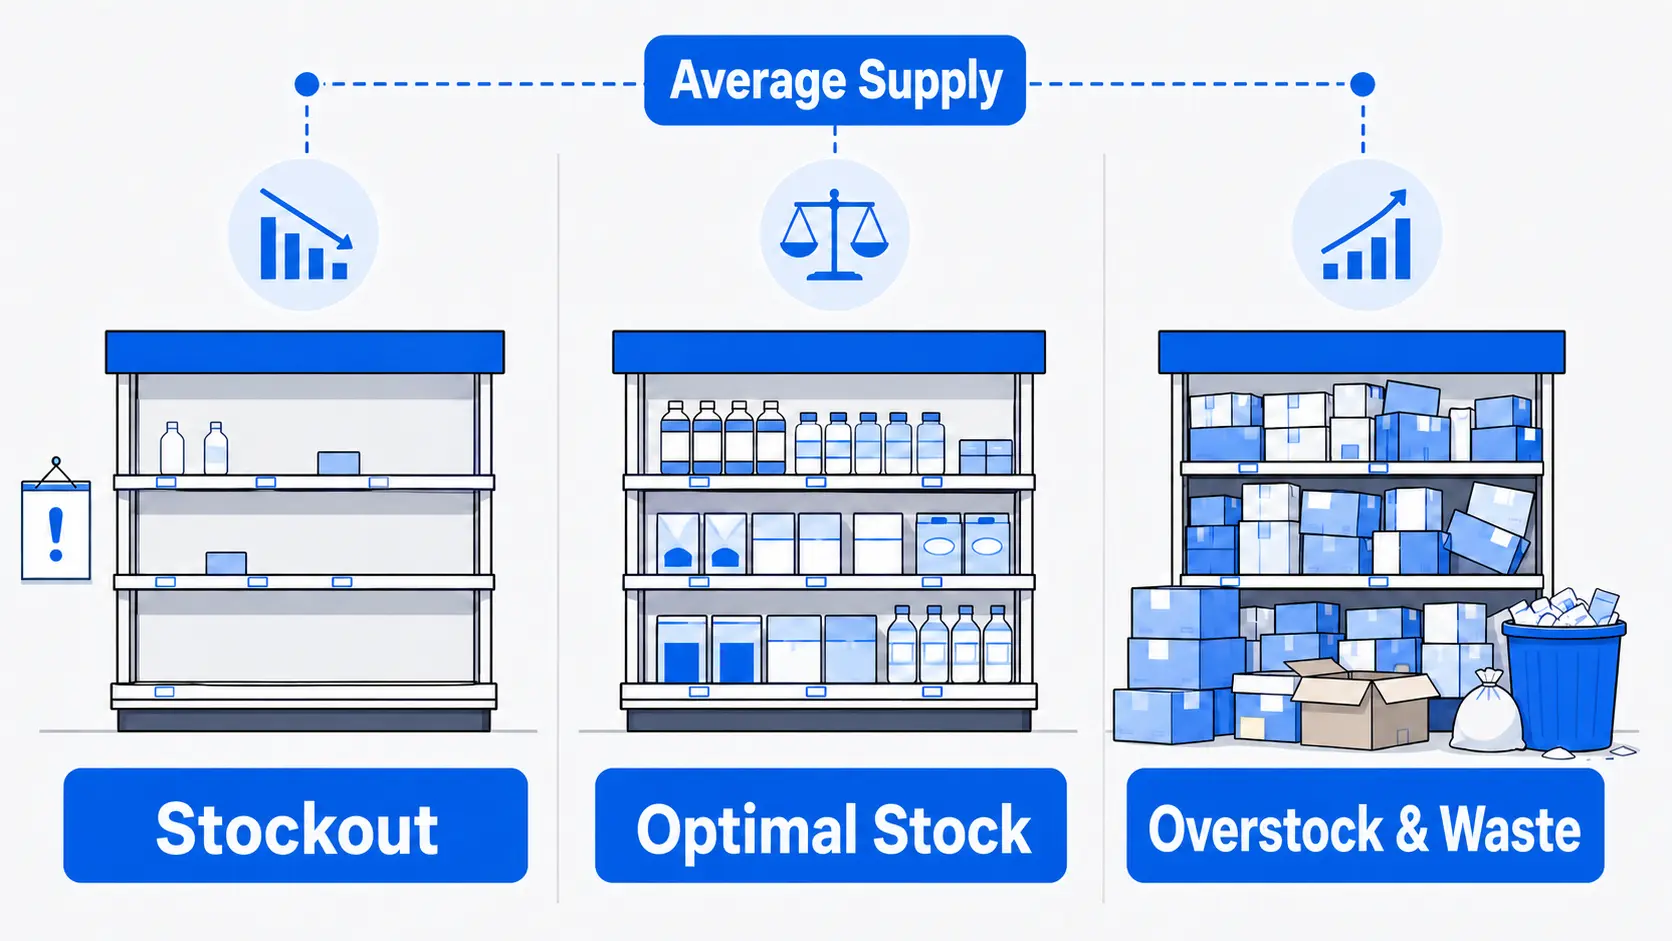
Many franchises start by dividing company-wide demand by the number of stores, or by carrying last month's sales straight into the next ordering baseline. The math is quick, but from a supply standpoint it's risky, because an average erases both the size and the variability of each store's demand.
Stockouts: lost sales show up first at high-demand stores
Stores that run above the average sell out of popular SKUs first. When a stockout hits during the lunch peak, the evening commute, or a weekend dinner, the sales opportunity is gone and a substitute product rarely recovers it. The inventory sheet reads "0," but what it really records is demand you could have served and didn't.
Overstock: volume piles up at low-demand stores
Stores that run below the average take in product faster than they sell it. Refrigerated and frozen space gets tied up, days of supply stretch out, and the same pattern repeats at the next order. When space and cash sit locked in inventory, the store has fewer options to work with.
Waste: the moment overstock becomes a fixed cost
In categories with short shelf lives, such as F&B, overstock turns into waste. A day or two of forecast error can spread into discarded raw materials, discarded finished goods, and end-of-day markdowns. Stockouts and waste look like opposite problems, but they share a cause: supplying on an average without looking at each store's demand separately.
So store-level forecasting isn't an exercise in showing off forecast accuracy. It's an operating baseline for deciding which stores get a higher order baseline at the next order, which stores can carry less safety stock, and which regions get production volume allocated first. McKinsey notes that AI-driven operations forecasting can reduce supply chain forecasting errors by 20–50% and cut product shortages and lost sales by as much as 65%. That figure isn't a guaranteed result for every franchise; it's better read as a reference point showing how far stronger forecasting can go in reducing stockouts and inventory losses.
What data does store-level forecasting need
To forecast demand store by store, you first have to capture, as data, what makes each store's demand different. POS sales alone don't cover it. Actual sales are the outcome, and supply optimization needs the conditions that produced that outcome alongside it.
Internal data: real sales and how the store runs
Internal data shows the demand and the operating flow inside the store. It includes POS sales, order counts, average ticket, sales by SKU, sales by time of day, stockout history, waste history, promotion and coupon use, delivery order share, operating hours, seat count, floor area, opening date, and renovation history. SKU-level sales and stockout and waste history in particular are the first data to check when adjusting order quantity and safety stock.
External data: the baseline demand set by trade area and access
External data explains the demand conditions a store can't easily control. It covers foot traffic in the trade area, resident population, age and income levels, weather, local events, the number of competing stores, access to subway stations and bus stops, delivery radius, and platform exposure metrics. Huff's classic trade-area model described the probability that a customer chooses a given store as a function of the store's attractiveness and distance. Even now that the delivery channel has grown, location and access remain important conditions that set baseline demand.
Time variables: the demand rhythm that shifts with the calendar and events
Time variables deserve a separate look. Day of week, public holidays, national holidays, school breaks, weather changes, local events, new-product launches, and promotions can swing a store's demand sharply even over a short window. Run the same promotion and an office-district store and a residential store may respond at different speeds. Miss that difference and headquarters sends down the same event volume, and on the ground one side runs short while the other has product left over.
Forecast cadence: matching the rhythm of the decision
When you gather data, decide the forecast cadence alongside it. For a company-wide business plan or S&OP, a monthly forecast may fit. If ordering, production, and logistics allocation need finer handling, design a cadence the work process can sustain. The point isn't that a shorter cadence is always better — it's that the forecast has to line up with the actual decision cycle.
The forecast connects first to order quantity and safety stock
Order quantity: use each store's forecast demand as the baseline
The first place store-level forecasting shows up in day-to-day work is order quantity. Demand planners and SCM managers set each store's forecast demand as the baseline, then read it against recent stockout and waste history, lead time, and days of supply. Stores where actual demand kept running above the forecast get a higher ordering baseline; stores where inventory lingers get a lower one.
The key here is not applying the same correction rate to every store. A lunch SKU in an office district and an evening SKU in a residential area move for different reasons. Looking at SKU-level and time-of-day forecasts together makes it clearer which volumes to raise and which to hold or trim.
Safety stock: not every store needs the same buffer
Safety stock should vary by store the same way. It's the buffer held for when demand comes in above the forecast, and it's usually set by looking at demand variability together with lead time.
Safety stock = safety factor × standard deviation of demand × √(lead time)
A store with large demand swings may need more safety stock, while a store where the forecast lands consistently can carry less. Put the same safety stock on every store and the high-demand stores still come up short while the low-demand stores hold even more. Store-level forecasting turns safety stock from a question of "how much to pile up" into one of "where to hold it, and how much."
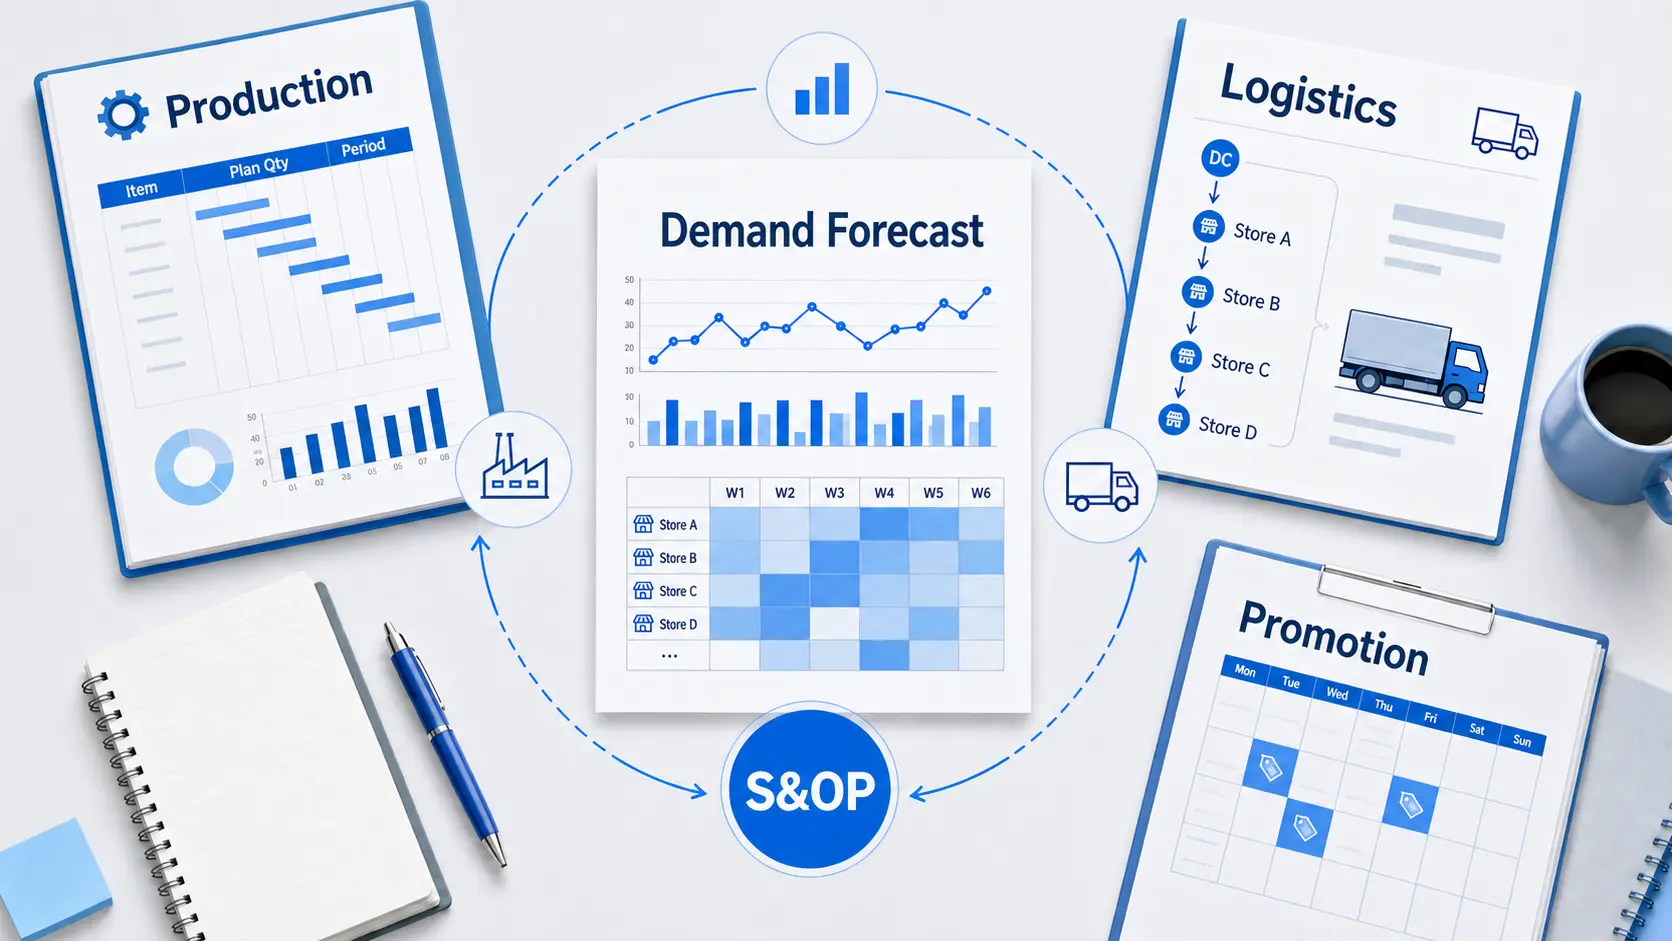
Production and logistics allocation and S&OP should start from the same demand number
Production and logistics allocation: roll store forecasts up to regional and company-wide demand
Store-level forecasts don't end at ordering and inventory. Sum the individual store forecasts and you get demand by region, by distribution center, and at the company level. Production and operations teams set production volume and supply schedules off that number, and logistics teams decide how much to send from which center to which store.
Trouble starts when store forecasts and the company plan move on separate tracks. If the store forecasts sum to 100,000 units but the company production plan is set at 80,000 — or production is ample but a particular region is under-allocated — rush production and expedited shipping keep recurring. Hyndman and colleagues proposed a method for reconciling forecasts across a hierarchy so that the higher- and lower-level forecasts add up. A franchise headquarters needs the same view: the forecasts for the whole company, the regional offices, the trade areas, and the individual stores have to agree, or the supply plan wobbles.
S&OP: reconcile each function's plan against one demand number
The same principle holds in the S&OP meeting. Sales brings the promotion plan, production brings equipment and raw materials, and logistics brings inventory by center and delivery capacity. When each function shows up with a different demand number, the meeting turns from reconciliation into persuasion. When the higher-level plan and the lower-level orders are aligned on store-level forecasts, new-product initial volume, promotion volume, raw-material purchase timing, and regional allocation can all be discussed on top of a single number.
Forecast review: use it as the basis for fixing the next supply plan
Forecast review is the mechanism that feeds back into this flow. It checks where the forecast and actual demand diverged, which SKUs saw repeated stockouts or waste, and where a trade area's response to a promotion came in off expectations. The point of the review isn't to grade stores. It's to correct the next forecast, ordering baseline, safety stock, and production and logistics allocation to fit better.
Store-level forecasting for F&B franchises, together with managing waste rate and days of supply, is covered in more depth in the F&B demand forecasting guide.
How Deepflow helps connect forecasts to supply decisions
Impactive AI is an AI decision-making solution company working in demand forecasting and raw material price forecasting. Deepflow analyzes internal POS and sales data together with external variables to support store-level demand forecasting, inventory optimization, SKU operations, and raw material price forecasting and purchasing-timing decisions. With Deepflow, a franchise headquarters can build forecasts that reflect trade area, size, seasonality, promotions, and SKU characteristics — instead of demand flattened into a store average — and review them as the basis for the supply plan.
Use by category: where F&B, retail, and fashion and beauty connect
An F&B franchise can tie store-level sales forecasts to production planning, days of supply, and waste-rate management. A retail franchise can use them for SKU allocation by store and channel and for preventing stockouts, and a fashion or beauty brand can read season-end sell-through and new-product demand differently by store type.
In practice: the reasoning behind an adjustment matters more than the forecast
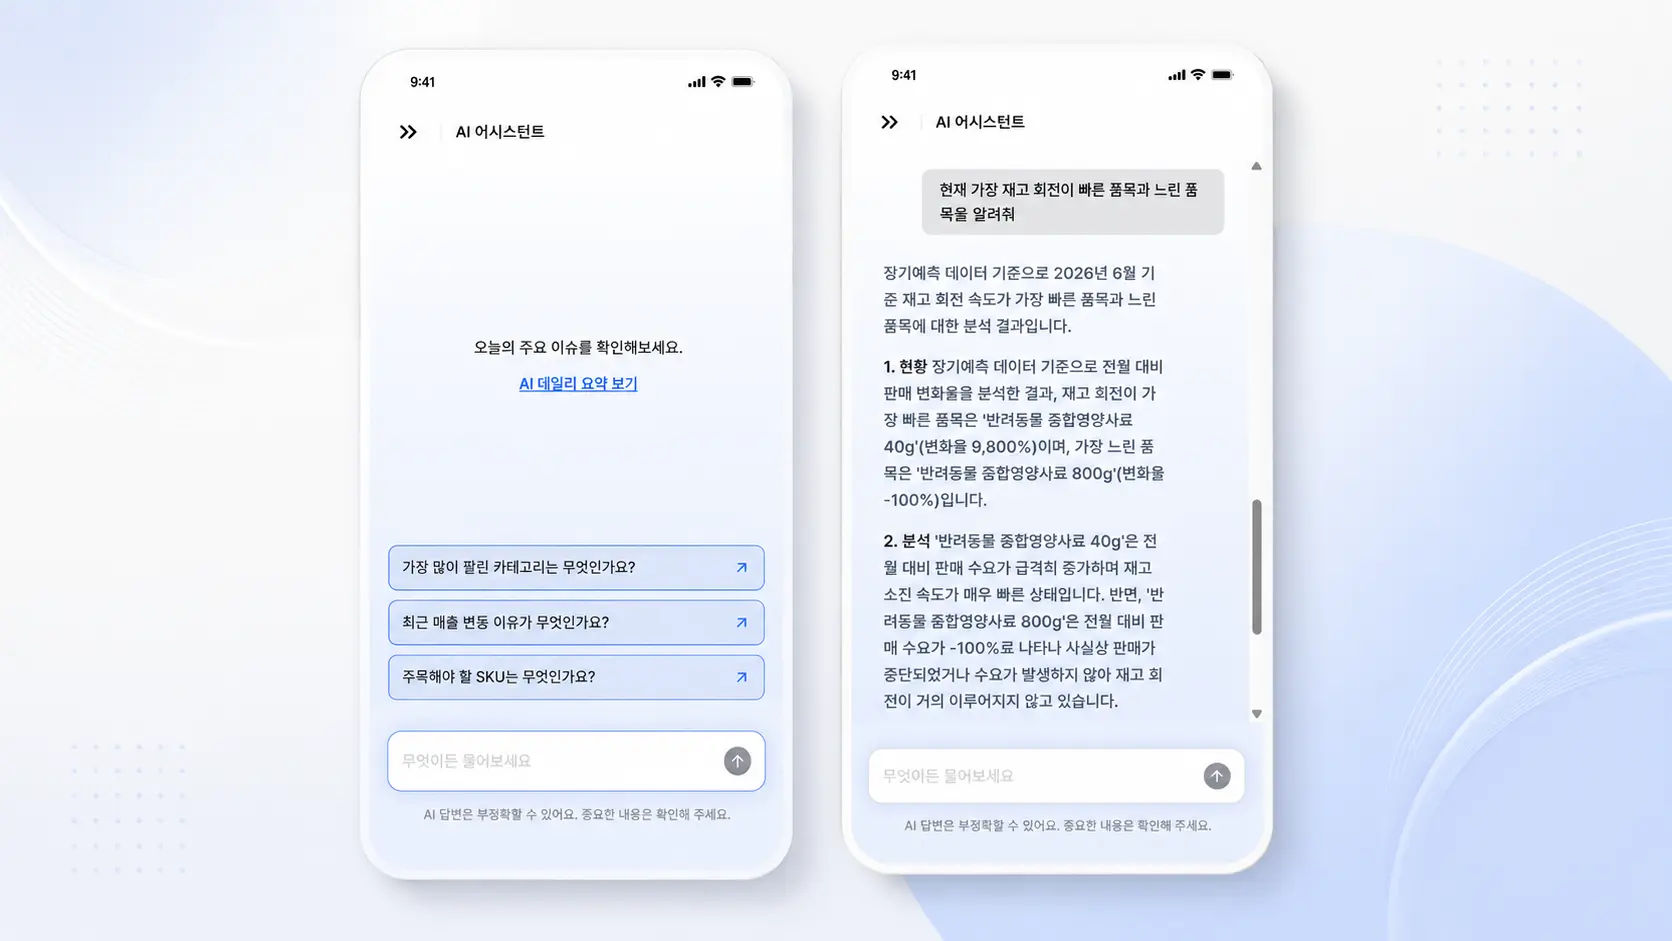
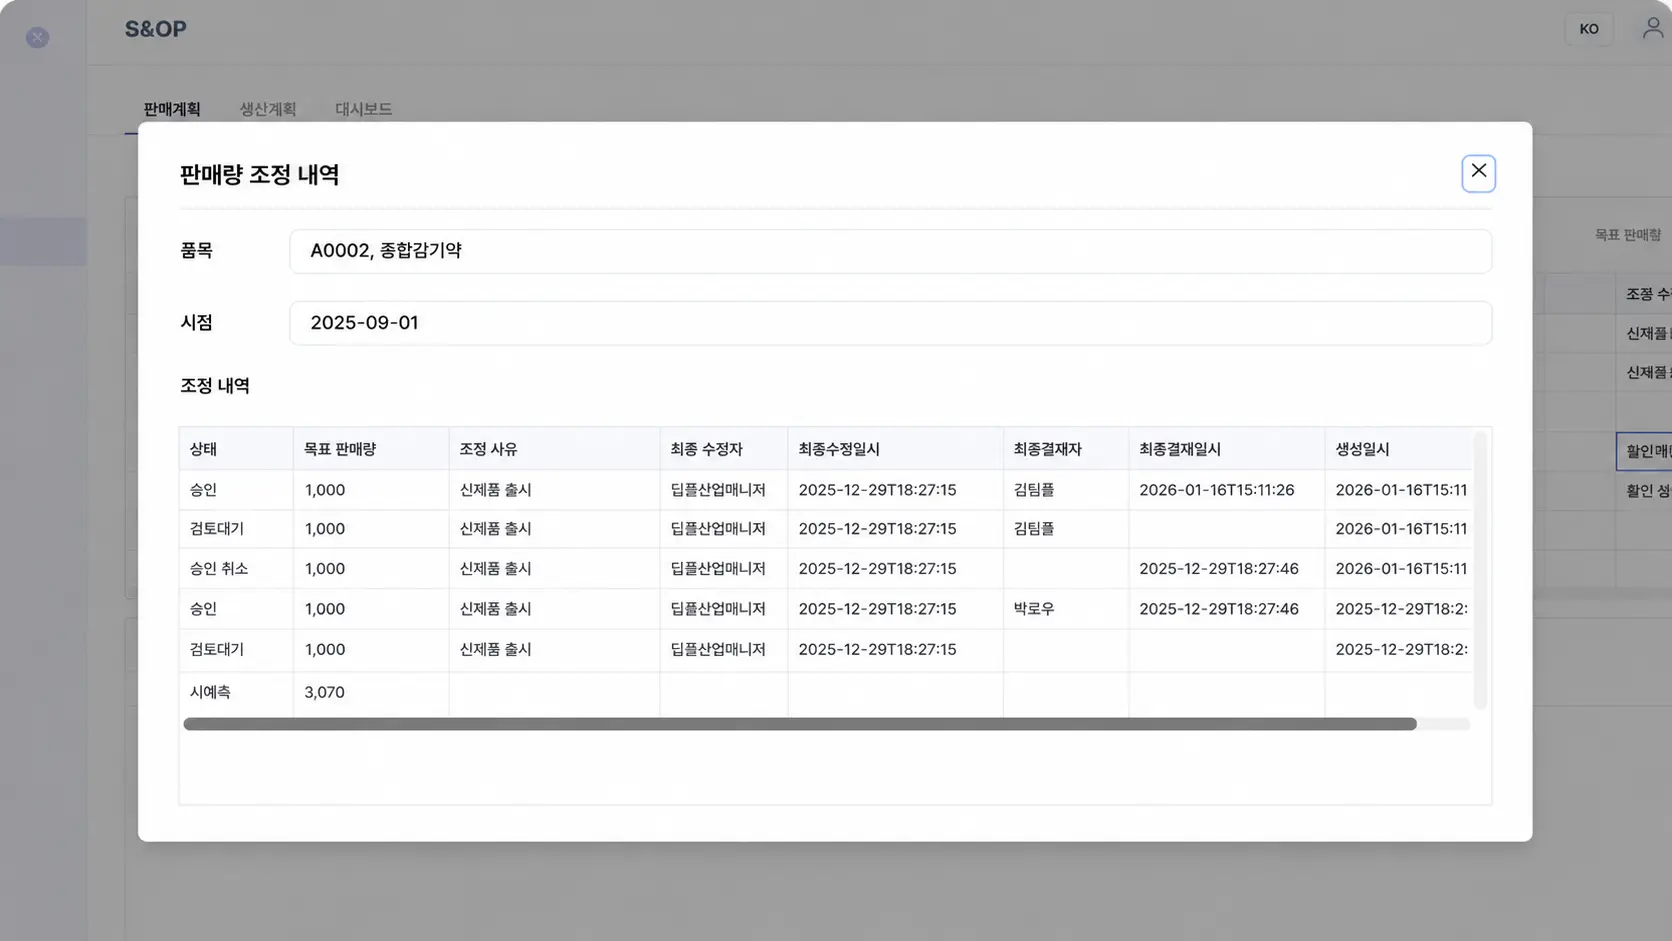
When describing Deepflow, the important point is not to treat it as a tool that only produces a forecast. A planner needs more than "what next month's demand will be" — they need to see why that number can be trusted, which stores and SKUs the error was largest at, and how to adjust order quantity and safety stock. Rather than stopping at the forecast, Deepflow acts as a bridge so that a planner can review the reasoning behind it and multiple scenarios together. In the end, the final decision rests on the planner's judgment, combining the accumulated data with conditions on the ground that change hour to hour.
Impactive AI advances its demand and price forecasting models on the basis of more than 224 forecasting models and 75 patents. That said, any model's results shift with data quality, the explanatory power of external variables, and the operating process on the ground. A realistic approach is to validate on core SKUs and major trade areas first, then widen the scope while watching forecast error and field feedback.
Checklist before adopting store-level supply optimization
If your franchise headquarters is weighing store-level forecasting and supply optimization, start by checking the items below.
- Are POS, order, SKU, promotion, stockout, and waste data organized at the store level?
- Is baseline information — floor area, seat count, operating hours, delivery share, opening date — current?
- Can you attach external variables such as trade area, foot traffic, weather, competing stores, and local events?
- Have you decided which decisions the forecast will feed: ordering, safety stock, production, logistics allocation, S&OP?
- Are you checking that store-level forecast demand and the company production plan add up to each other?
- Do you know which store groups and SKUs saw the largest stockouts and waste in past periods?
- For stores with recurring forecast error, do you check the cause using both data and input from the field?
- Do you have a procedure for feeding forecast results into the next ordering baseline and safety-stock adjustment?
Frequently asked questions (FAQ)
Q1. Why should franchise demand forecasting be done store by store?
Even under one brand, when trade area, size, operating hours, and delivery share differ, the volume each store needs differs too. Forecasting store by store is what lets you tune order quantity and safety stock to each store's conditions.
Q2. What's the biggest problem with supplying on average demand?
High-demand stores run into stockouts while low-demand stores build up overstock and waste. An average looks easier to manage, but it can widen the supply error store by store.
Q3. Should safety stock also differ by store?
If demand variability and lead time differ by store, safety stock should too. Put the same safety stock everywhere and the short stores stay short while the overstocked stores hold even more.
Q4. How do store-level forecasts connect to production planning?
Sum the individual store forecasts and you get regional and company-wide demand. That number becomes the shared basis for production volume, distribution-center allocation, promotion volume, and the S&OP meeting.
Q5. At which stage can Deepflow be used?
It can be used in combining internal and external data, forecasting demand store by store, checking the reasoning behind a forecast, running SKUs, optimizing inventory, and preparing for S&OP discussions. Early on, validating with core SKUs and major trade areas first works well.
Wrapping up
Franchise demand forecasting is a working baseline for matching supply to each store. Fold stores that differ in trade area, size, SKU mix, time of day, and delivery share into a single average, and stockouts, overstock, and waste appear together. Forecast demand store by store instead, and you can tune order quantity and safety stock and align production and logistics allocation and S&OP on the same number.
What matters is less the forecasting model itself than the structure that carries the forecast into an actual decision. When headquarters understands the demand differences between stores and reflects them in the supply plan, inventory comes down and the response to stockouts gets faster. Impactive AI's Deepflow supports that review on a data basis, helping a franchise headquarters use store-level forecasting as the basis for supply optimization. If you want to see what supply plan your own franchisee data could support, you can start by diagnosing core SKUs and major trade areas.
References
- Huber, J. & Stuckenschmidt, H. "Daily retail demand forecasting using machine learning with emphasis on calendric special days." International Journal of Forecasting, 2020. https://doi.org/10.1016/j.ijforecast.2020.02.005
- Hyndman, R. J., Ahmed, R. A., Athanasopoulos, G. & Shang, H. L. "Optimal combination forecasts for hierarchical time series." Computational Statistics & Data Analysis, 2011. https://doi.org/10.1016/j.csda.2011.03.006
- Huff, D. L. "A Probabilistic Analysis of Shopping Center Trade Areas." Land Economics, 1963. https://doi.org/10.2307/3144521
- Korea Fair Trade Commission. "Results of the 2025 franchise sector survey." https://www.ftc.go.kr/www/selectBbsNttView.do?bordCd=3&key=12&nttSn=46828
- McKinsey & Company. "AI-driven operations forecasting in data-light environments." 2022. https://www.mckinsey.com/capabilities/operations/our-insights/ai-driven-operations-forecasting-in-data-light-environments
-
.svg)

.svg)





%201.svg)
%202.svg)


.svg)