.svg)

.svg)
%202.svg)
Reorder Timing Strategies to Reduce Stockout Opportunity Costs

Why Stockout Opportunity Costs Run Deeper Than Lost Sales
A Multi-Layered Loss Structure Beyond the Day's Revenue
When people in retail hear "stockout opportunity cost," the first thing that comes to mind is usually the revenue lost on that particular day. But what a business actually loses tends to be far more extensive. The opportunity cost of a stockout goes well beyond the absence of same-day sales — it cascades into customer attrition, spikes in emergency logistics costs, and erosion of brand trust.
How Customer Churn Scales to Lifetime Value
This is where the chain reaction begins. A significant share of customers who leave after a stockout experience never return, meaning the loss can extend from a single transaction to a reduction in overall customer lifetime value (LTV). Analysis suggests that brand attachment among Millennial and Gen Z consumers is notably weaker compared to previous generations, and these shoppers are more inclined to switch to a competitor when the product they want is unavailable. In a market where brand loyalty is thinning out, a stockout is no longer just a minor disappointment — it increasingly functions as an irreversible churn trigger.
The Real Reasons Behind Missed Reorder Timing
Ordering Criteria That Fail to Reflect Demand Variability
Preventing stockouts requires placing reorders before inventory runs dry. The principle is straightforward, but in practice, this seemingly obvious sequence breaks down more often than it should. The primary culprit is a decision-making structure where orders are placed without adequately accounting for demand variability. Ordering criteria based on historical average sales or a manager's intuition struggle to pinpoint the right reorder window when demand shifts abruptly due to seasonal swings, promotional effects, or external disruptions.
When cash flow constraints enter the picture, complexity multiplies. While specifics vary by industry and contract terms, there is typically a considerable lag between delivery and settlement, and production or overseas sourcing lead times are often far from short. If demand forecasts are inaccurate and working capital isn't recovered on time, frontline planners tend to defer orders until inventory nears critical levels. By the time the order is finally placed, factoring in the lead time, the shelf is already empty.
How Forecast Accuracy Simultaneously Governs Inventory and Capital Efficiency
Stockout opportunity costs ultimately arise from a structure where forecast accuracy governs both inventory levels and capital efficiency at the same time. Holding excess inventory ties up capital and increases disposal costs; reducing inventory raises the risk of stockouts. For decision-makers trying to strike a balance within this dilemma, the critical variable is how accurately they can project future sales.
Three Key Metrics for Evaluating Stockout Opportunity Costs
Walk-Away Rate as an Immediate Signal of Customer Loss
The first metric is the walk-away rate — the percentage of customers who leave the store without purchasing a substitute when a specific SKU is out of stock. Products with higher uniqueness and fewer alternatives tend to show elevated walk-away rates.
Indirect Losses Hidden Within the Substitution Rate
The second metric is the substitution rate, which measures how often customers switch to a different product within the same store. While substitution preserves immediate revenue, it can carry indirect costs such as margin compression from shifts to lower-margin items and weakened negotiating leverage with manufacturers.
Expected Loss from Combining Churn Probability with Customer Lifetime Value
The third metric is expected loss, calculated by multiplying churn probability by customer lifetime value. This approach estimates the revenue a business stands to forfeit when a customer who has experienced repeated stockouts decides not to come back. Analyzing these three metrics at both the SKU level and the customer segment level reveals hidden opportunity costs that far exceed the visible revenue shortfall.
How Demand Forecasting Aligns Reorder Timing with Settlement Cycles
SKU-Level Long-Range Forecasting Creates Ordering Headroom
Avoiding missed reorder windows under cash flow constraints comes down to two things. The first is forecasting future demand as far out — and as accurately — as possible. The second is connecting those forecasts to procurement and financial planning in real time.
For example, if a business can project sales trends six to twelve months ahead at the SKU level, it can coordinate when and how much to order in advance — even when working capital gets tight. Items with long lead times can be managed through split-order strategies timed to settlement delay windows, while high-turnover items can be maintained at minimum safety stock levels with preemptive volume secured ahead of demand surges.
How External Variable Forecasts Sharpen Decision-Making
Layering in forecasts for external variables like exchange rates, raw material prices, and fuel costs takes decision-making resolution up another notch. For retailers with significant overseas sourcing, currency fluctuations directly impact unit purchase costs, so referencing short-term exchange rate outlooks when evaluating order timing can help manage procurement cost volatility.
A Data-Driven Approach to Reducing Stockout Costs — Deepflow's Role
Building an Evidence Base for Orders Through SKU-Level Long-Range Forecasting
ImpactiveAI's AI demand forecasting solution, Deepflow, serves as a tool that can ease decision-makers' burden at exactly this juncture. Powered by advanced machine learning and proprietary patented technology, Deepflow forecasts sales and shipment volumes at the SKU level up to six to twelve months ahead. Because it delivers item-level granularity rather than stopping at aggregate revenue projections, it provides the evidence base needed to calibrate reorder timing to each product's characteristics and lead time.
Managing Inventory Depletion Days and Working Capital Through a BI Dashboard
The BI dashboard automatically calculates and displays inventory depletion days by factoring in current stock levels and projected sales fluctuations. It can flag the point at which a given SKU's remaining inventory days drop below its lead time, enabling teams to prioritize high-risk items even when settlement-cycle delays are holding up orders. Overstocked SKUs are also surfaced, making it easier to identify where capital is locked up and reallocate working capital toward items where reordering is most urgent.
Closing Collaboration Gaps Across Departments with an AI Assistant
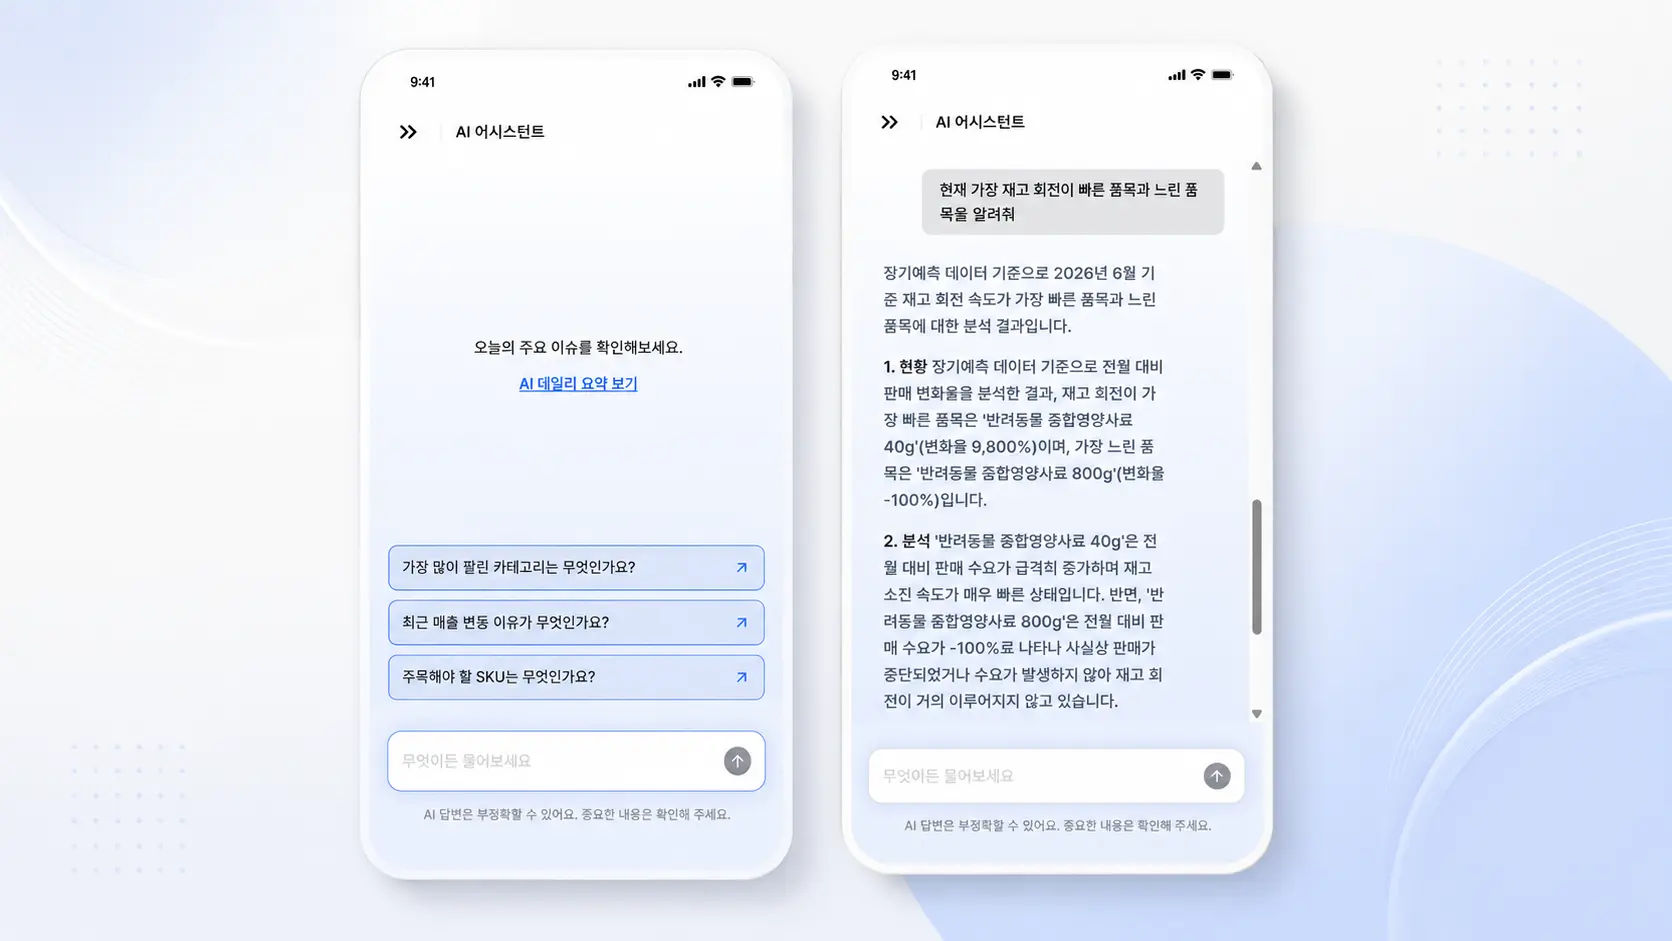
The AI assistant newly integrated into Deepflow Materials lets users ask questions about raw material price outlooks, key fluctuation drivers, and market developments — and receive immediate answers. By summarizing core insights from forecast outputs and market data, it reduces the time spent manually aggregating information scattered across multiple sites and reports, giving teams faster access to the intelligence they need for reorder timing decisions. This capability is especially valuable for companies with heavy overseas sourcing exposure, where exchange rates and commodity market shifts directly affect order pricing.
In addition, the LLM-powered analysis report feature generates reports that automatically organize forecast rationale, historical sales patterns, and department-specific action strategies. With sales, SCM, and finance teams working from the same data foundation, the time and friction involved in aligning reorder timing with cash flow planning can be meaningfully reduced.
Checkpoints for Managing Stockout Opportunity Costs
Ensure Data Integrity
The first area for retail decision-makers to examine is whether SKU-level sales data and inventory data are accurately synchronized. When system-recorded inventory diverges from what's actually on the shelf, no forecasting model can perform effectively.
Redesign Reorder Criteria
The next area worth reviewing is whether reorder criteria simultaneously account for lead time and settlement cycles. Ordering based on historical average sales has been the standard for a long time, but it tends to fall short for items subject to significant demand variability or heavy exposure to external factors.
Audit Cross-Departmental Data Sharing
The final checkpoint is the level of data sharing between SCM, finance, and sales. If forecast outputs are not reflected in both the sales plan and the funding plan simultaneously, situations can arise where order approvals are delayed despite low inventory — or where additional orders are placed when stock is already sufficient.
Conclusion — Availability Is Ultimately a Financial Performance Issue
Stockout opportunity costs do not stay confined to logistics or inventory management; they are increasingly a financial performance issue where cash flow and reorder timing are intertwined. A single empty shelf space on the sales floor creates a structure where the impact extends beyond that day's lost revenue to customer attrition and the next quarter's working capital plan.
The question decision-makers need to ask is not "how much inventory should we hold" but rather a more precise one: "when should we secure which items, and in what quantity?" AI-powered demand forecasting functions as a mechanism for reducing uncertainty in the process of answering that question. Rather than being the answer itself, its value lies in serving as a support tool that helps frontline operators and executives make better-informed decisions.
Frequently asked questions about out-of-stock opportunity costs
Q1. What does stockout cost mean?
Stockout cost refers to the full spectrum of losses a business incurs when a product goes out of stock and can no longer be sold. Beyond the immediate absence of sales, it extends into customer attrition, rising emergency logistics expenses, and declining brand credibility.
Q2. What happens when stockout opportunity costs are high?
A significant share of customers who leave after a stockout experience tend not to return, meaning the loss can scale from a single transaction to a reduction in overall customer lifetime value (LTV). In a market where brand loyalty is weakening, stockouts increasingly function as irreversible churn triggers rather than mere inconveniences.
Q3. What metrics should be used to evaluate stockout opportunity costs?
Three key metrics are commonly referenced when gauging the real impact of stockouts. The walk-away rate measures the share of customers who leave without purchasing anything. The substitution rate captures how often customers switch to a different product within the same store. Expected loss is calculated by multiplying churn probability by customer lifetime value.
Q4. What are the main reasons for missing the reorder window?
The primary cause is an ordering structure that fails to adequately reflect demand variability. When this is compounded by cash flow constraints — where working capital is not recovered on time due to delayed settlement cycles — frontline planners are more likely to repeatedly defer orders.
Q5. How does demand forecasting help with reorder timing and cash flow management?
When sales trends can be projected six to twelve months ahead at the SKU level, businesses can coordinate order volumes and timing in advance — even during periods of constrained working capital. Long-lead-time items can be managed through split-order strategies, while high-turnover items can be maintained at safety stock levels with preemptive volume secured ahead of anticipated demand surges.
.svg)


.svg)