.svg)

.svg)
%202.svg)
Essential Report Writing Skills Every Demand Forecasting Manager Must Know

If your executives aren't responding to your accurate monthly demand forecasts, the problem likely isn't with your prediction accuracy but with how you present the information. The most critical skill for demand forecasting managers is the ability to transform complex forecast results into clear, actionable insights that executives can understand at a glance and make decisions from immediately.
The Core of Demand Forecast Reports Is Deriving Insights
Executives Don't Want Numbers
Most demand forecast reports fail to achieve their objectives for a simple reason. When you list forecast values for thousands of SKUs, you lose sight of the core message.
Executives need to quickly grasp current situations and make decisions within their busy schedules. They must decide on next quarter's strategy in that same timeframe.
Answer Three Questions First
An effective demand forecast report must clearly answer three questions. First, which products require immediate attention, why these products matter, and what actions we should take going forward. When the answers to these three questions are immediately visible on the first page of your report, you'll capture executive attention.
For example, you might state that seasonal Product A will be completely out of stock within three weeks before peak season begins. The opportunity loss from this stockout could reach $400,000. In contrast, Product B has accumulated two months of excess inventory, generating $20,000 in additional storage costs monthly. Presenting specific amounts and timeframes like this works effectively.
This approach of highlighting key issues and financial impact first, with detailed data organized later, proves most effective. When you convert each issue's impact on revenue or costs into monetary terms, executives immediately pay attention.
Data Visualization in Demand Forecasting Determines Decision Speed
The same data can have vastly different impact depending on how you visualize it. Three visualization types work most effectively in demand forecast reports.
Show Trends with Time Series Graphs
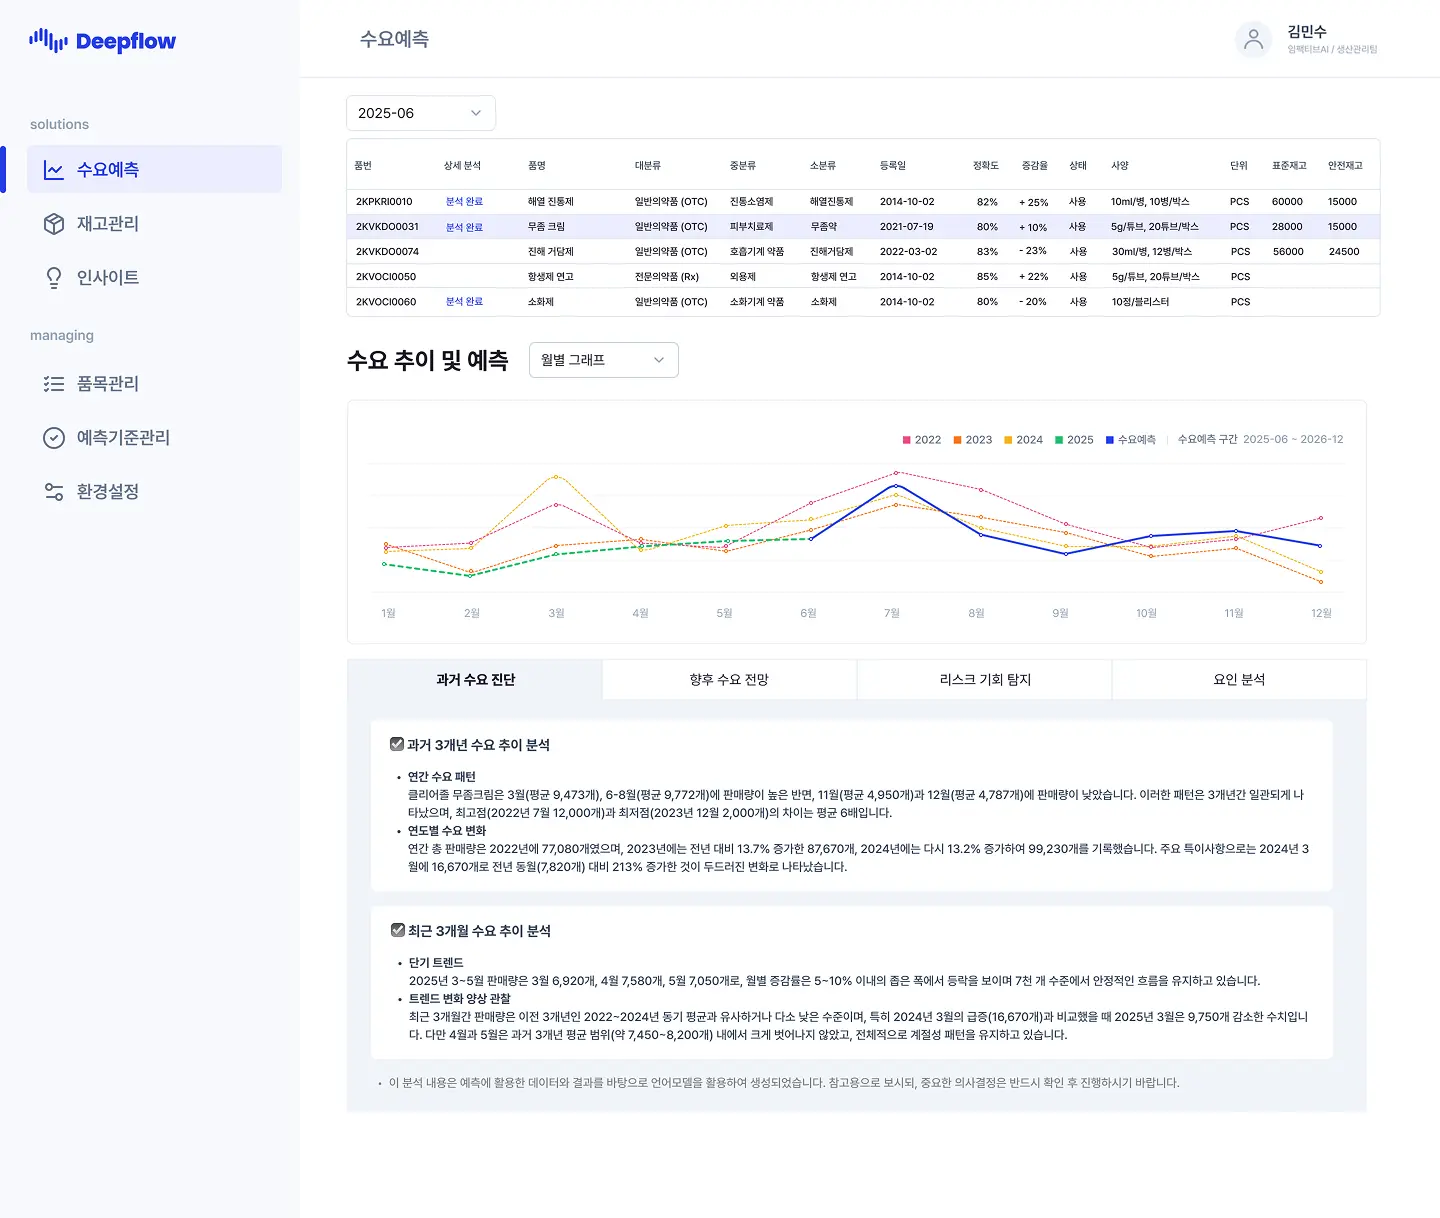
The first is time series graphs. You should be able to see the past twelve months of performance and six months of future forecasts on one screen. Distinguishing actual performance with solid lines and forecasts with dotted lines makes things clearer.
When forecast confidence intervals are shown with shading, even uncertainty becomes visually communicated. If a specific product's demand is forecast between 10,000 and 15,000 units, you visually show the minimum-maximum range.
Inventory Issues Must Be Visible at a Glance
To facilitate quick business decisions, you need to see inventory status at a glance and easily identify which items have stock shortages or excess inventory.
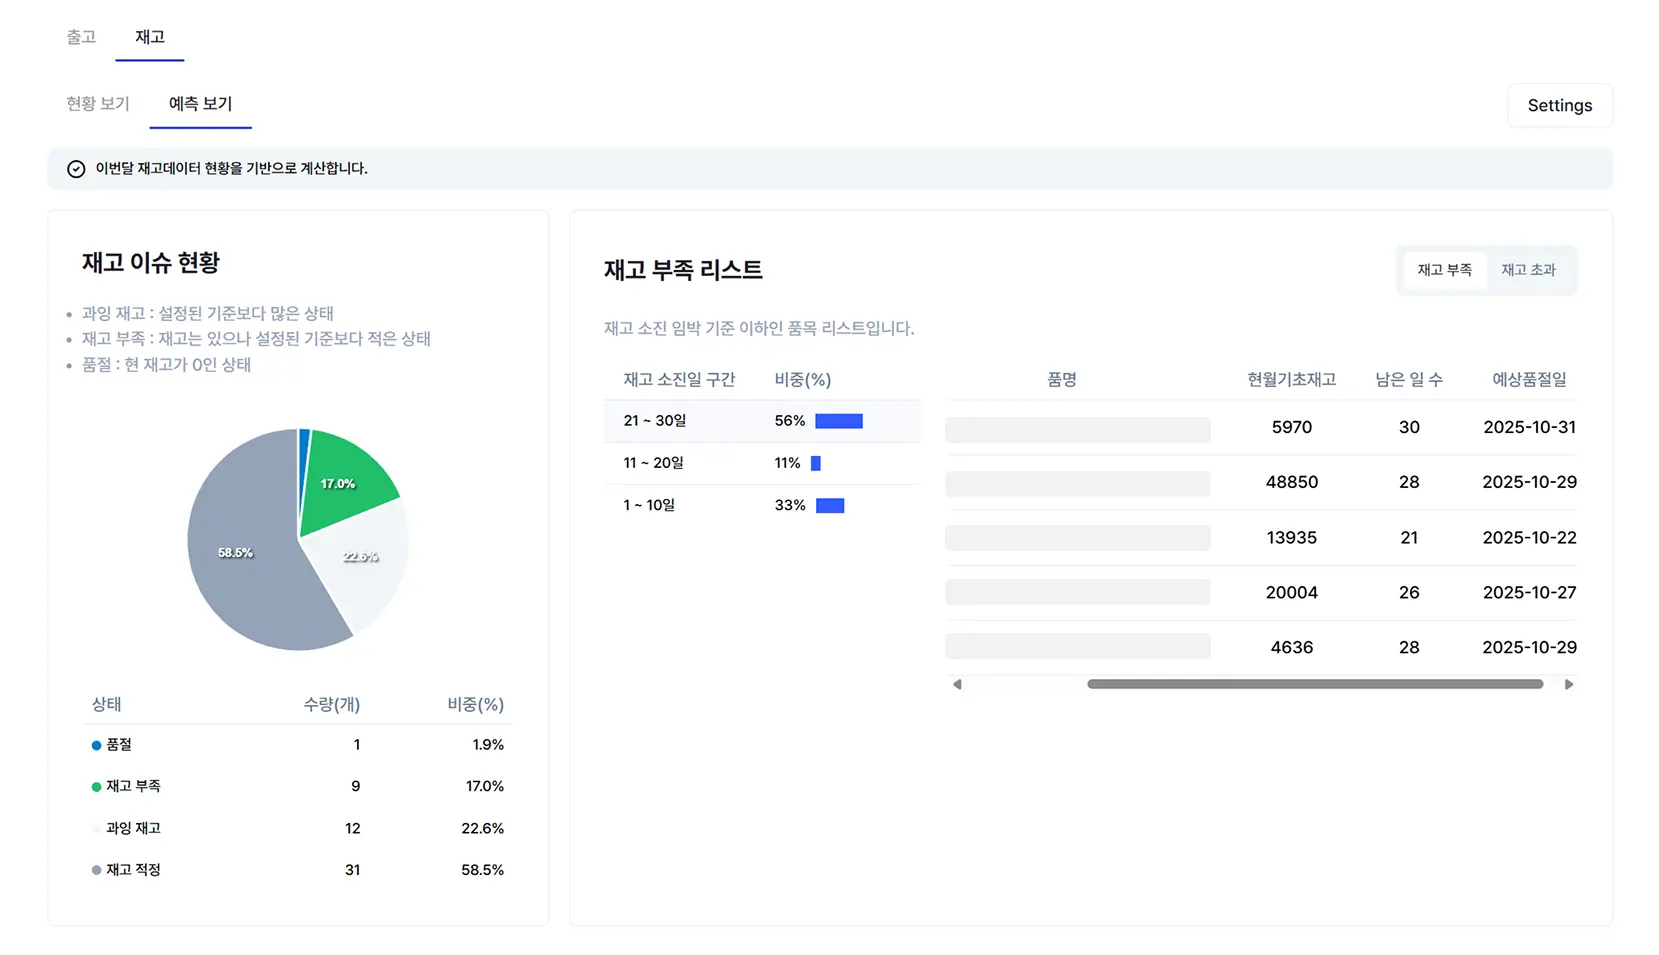
Using a BI dashboard allows you to see stock shortages, excess inventory, and optimal inventory levels at a glance. When you present what percentage of total items are at risk of stock shortage and what percentage have excess inventory using a pie chart, you can immediately understand the current inventory situation.
Showing both understocked and overstocked items together on one view makes the situation much clearer. For example, you can organize remaining inventory intuitively by days until depletion such as within 21-30 days, within 11-20 days, or within 1-10 days. Additionally, when you show the current remaining quantity for each item, how many days until depletion, and the exact projected stockout date together, managers can immediately prioritize which products need attention first.
Use Shipment Volume and Inventory Status to Drive Quick Decisions
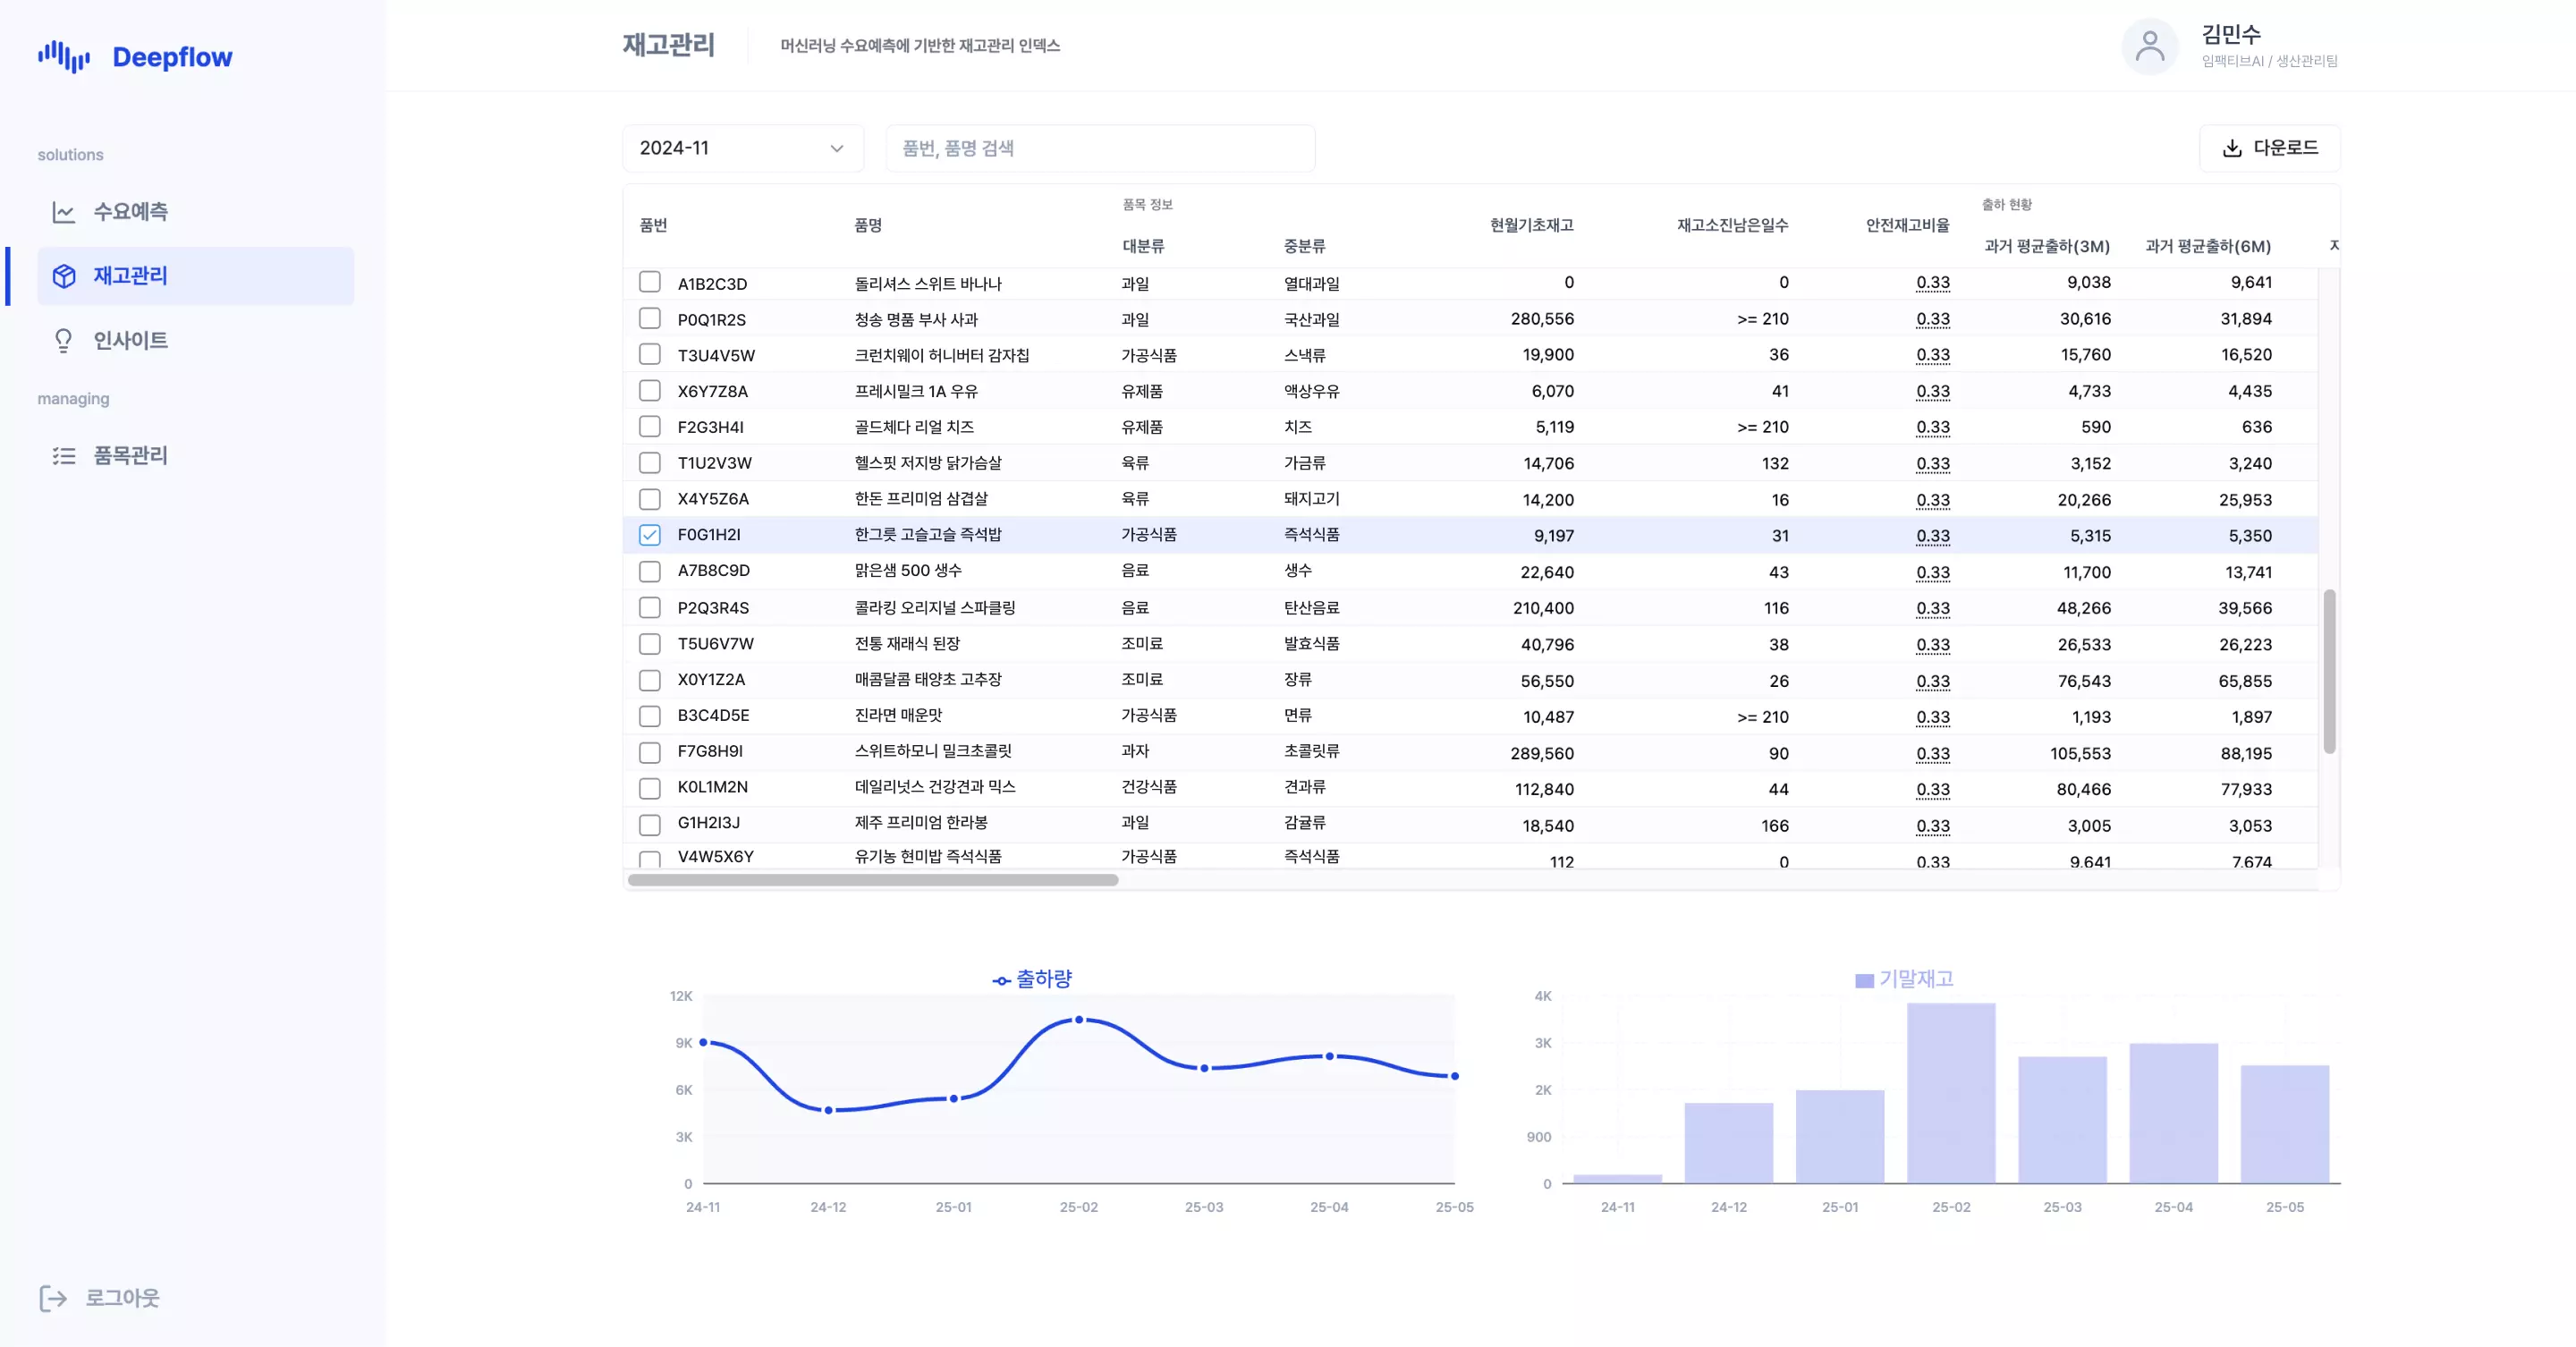
Effective demand forecast reports must include visualizations that combine outbound volume and ending inventory. When you put the past three months of actual shipment trends and current inventory levels on one screen, executives can immediately make decisions like adjusting safety stock.
For example, if a specific product's monthly shipments are steadily increasing while ending inventory remains low, the moment you see the report you think that safety stock should be increased. Conversely, when shipments plateau but inventory accumulates, you can immediately consider inventory reduction measures.
These visualizations lead to much faster decisions than simply listing numbers. Showing trends and current status simultaneously with one graph proves more effective than a manager explaining that the past three months' average shipments were 10,000 units and current inventory is 5,000 units.
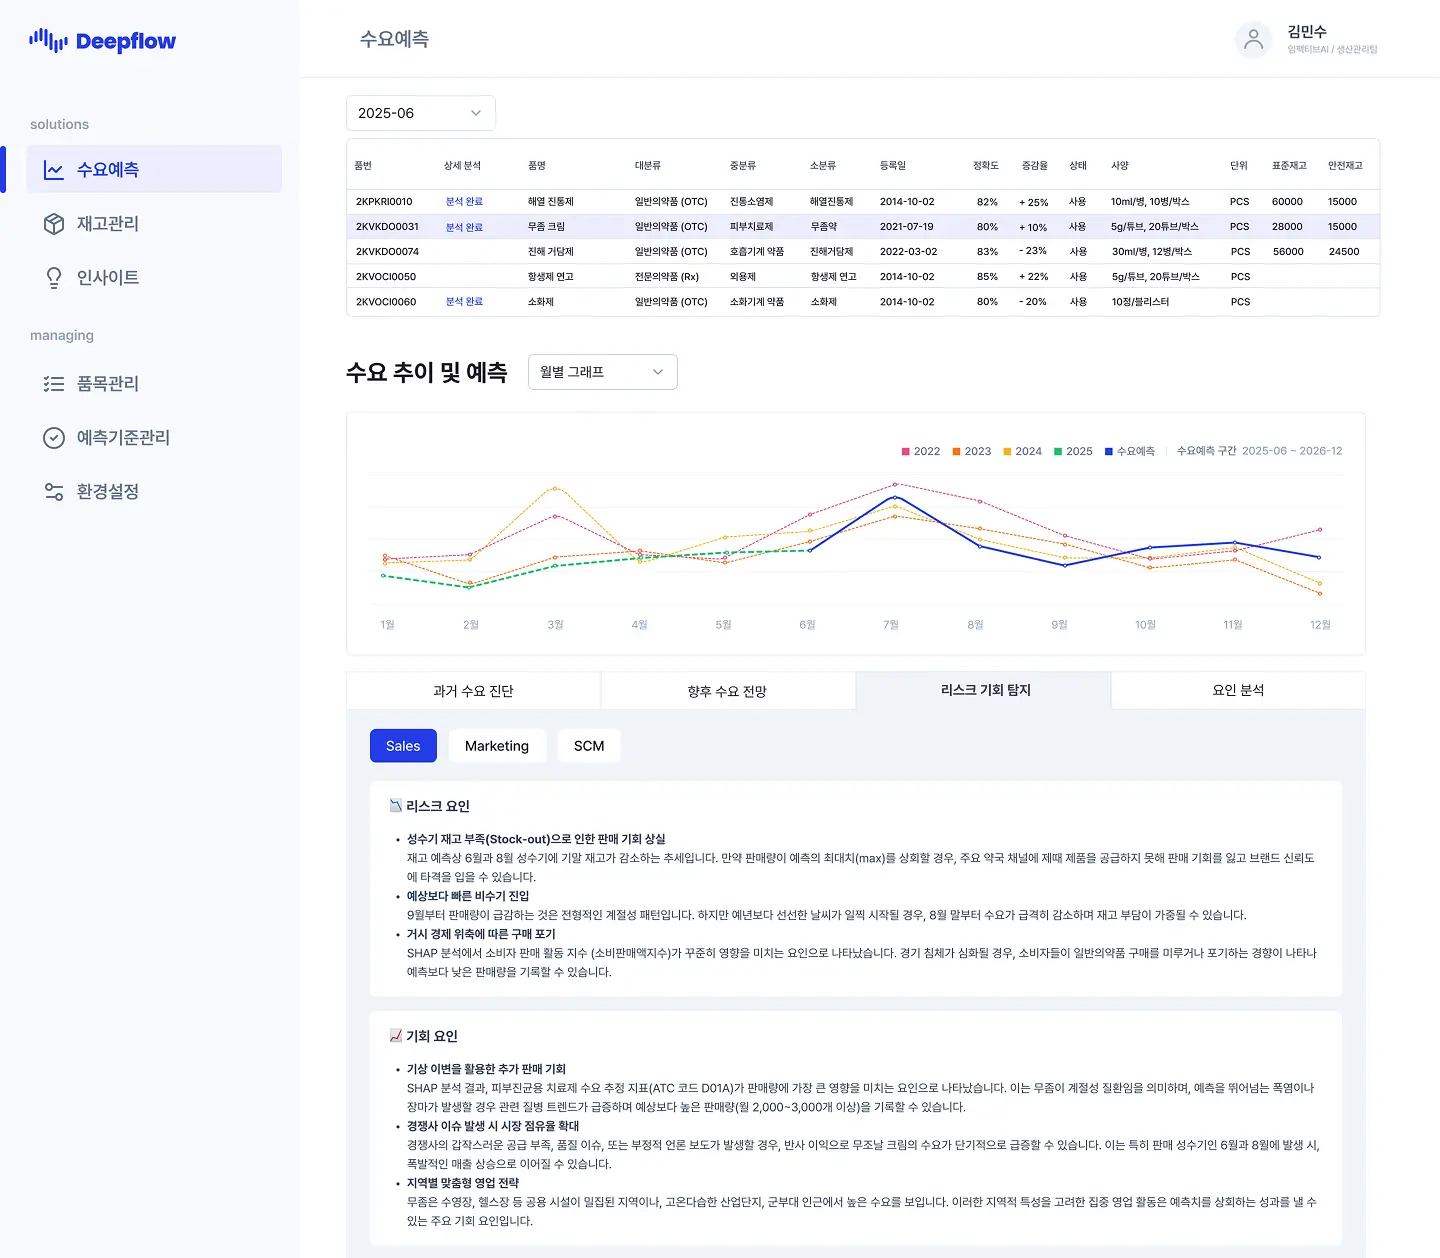
AI-Generated Dashboards
Recently, AI-based demand forecasting solutions automatically provide these visualization features. Taking ImpactivAI's Deepflow as an example, it automatically identifies products with potential stock shortages or excess inventory. Through the web dashboard, you can easily see in real-time what issues each product has and their proportions.
Because results are immediately displayed in easy-to-read BI screens, managers don't need to struggle creating charts in Excel. Since the system automatically visualizes key issues, managers can now focus solely on strategic judgment.
Clear Rationale for Demand Analysis Results Builds Trust
Saying It's an AI Forecast Isn't Enough
The biggest reason executives struggle to trust demand forecast results is that they can't clearly see what process produced the forecast.
Simply saying that AI predicted it isn't sufficient. You absolutely must explain specifically what major factors influenced the forecast. Only then can they accept and trust the forecast results.
Present Specific Influencing Factors
For example, suppose summer beverage demand is expected to increase by 20% over last year. Several important factors lie behind this. Recent temperatures have been rising steadily, and major competitors have also raised their prices. Moreover, the summer beverage market has grown an average of 15% annually over the past three years.
Looking at these points, you can see that this forecast doesn't simply repeat past trends but results from multiple external factors working together.
Showing Contribution Rates Makes It Perfect
Advanced systems like Deepflow specifically show which variables contributed most to the forecast results. For example, they clearly display the top 20 influencing factors at a glance, such as exchange rates at 30%, seasonality at 25%, and competitor pricing at 20%.
From the executive perspective, rather than simply checking numbers, they can directly understand the logical basis for forecast results and make decisions. This preemptively prevents questions like why did we get these results.
How to Present Action Recommendations for Predictive Inventory Management
Don't Stop at Situation Analysis
Good demand forecast reports propose specific action plans. Suppose inventory shortages are predicted. The conclusion of this forecast shouldn't end with projected stock depletion in three weeks.
State clearly that an emergency order of 15,000 units is needed by Friday this week. Considering lead time, delivery is possible next Wednesday. Specify concrete numbers and schedules like this.
Compare Multiple Scenarios
What if excess inventory is expected. You might say that promotional sales of 500 additional units weekly for four weeks are needed during November. With a 15% discount, the margin decrease amounts to $80,000. However, storage cost savings total $120,000, so net profit improves by $40,000.
Comparing multiple options and their outcomes like this enables much more rational decision-making.
Present Both Risks and Opportunities Simultaneously
In a conservative scenario, you maintain high safety stock. Costs increase but there's no stockout risk. In an aggressive scenario, you minimize inventory. Costs are reduced but stockout risk exists.
Clearly show the tradeoffs in each case. Executives make optimal choices that match their company's risk appetite based on this information.
Shorten Reporting Cycles Through Demand Forecast System Automation
Monthly Reports Are Already Too Late
Even perfectly formatted reports lose half their value when provided only once a month. Market conditions change rapidly. Demand forecast results should be updated at least weekly.
However, realistically it's difficult for managers to create new reports every week.
Automation Is the Answer
The key to solving this problem is automation. When data updates, forecast models automatically retrain. Build a system where dashboards refresh in real-time.
Managers can focus only on items with issues. Replace regular reports with automatically generated dashboards and reports from the system. Managers only write separate reports for exceptional situations or parts requiring strategic judgment.
AI-Generated Insight Reports Automatically - Deepflow
Using ImpactivAI's Deepflow can significantly reduce the time demand forecasting managers spend on report writing.
Most importantly, LLM-based analysis reports bring major changes. After automatically examining past sales trends and seasonal patterns, they organize future demand forecasts and their rationale. Going one step further, they also propose execution strategies tailored to each department including sales, marketing, and SCM. Practitioners can quickly review only the critical risk and opportunity factors essential to them, making work much more efficient.
This significantly reduces time spent interpreting complex data and writing reports, allowing focus solely on strategic decision-making, which is a major advantage.
BI dashboards show understocked or overstocked items at a glance and automatically calculate days until stock depletion and appropriate production volumes. Managers can report visualized materials directly to executives without separately organizing Excel files, making work much simpler.
MI dashboards can track external environment data like exchange rates, interest rates, and raw material prices in real-time.
Ultimately, this case clearly shows that while accurate forecasting matters, the real business results come from how quickly and practically you can provide results in a usable format.
Report Writing Tips for Demand Forecasting Managers
One common mistake when writing reports is putting lengthy methodology explanations at the beginning. From the executive perspective, which algorithm you used doesn't actually matter. What they really want to know is what the results are and what we should do going forward.
Therefore, technical content like methodology, data sources, and model accuracy should be organized separately in an appendix, while the main body should focus on insights and specific recommendations.
The first page should contain an executive summary that's immediately visible. Present three key messages and five recommended actions clearly organized.
Pages two and three should provide detailed analysis of products with major issues, including helpful visualizations for understanding.
Pages four and five should add forecast summaries for all product lines and a risk matrix to show the overall picture.
In the appendix, organize the complete SKU list, forecast methodology, data sources, and accuracy validation results.
Busy executives actually need to make quick decisions based only on the first page. Practitioners responsible for actual execution should be able to develop implementation plans from just pages two and three. Organizing the appendix so it can be referenced only when absolutely necessary proves effective.
Demand forecast reports aren't simply documents listing data. They're strategic tools driving organizational decision-making. Rather than just listing numbers, communicate the core insights derived from those numbers. Don't stay with static reports but provide actual dashboards when needed so information can be checked in real-time. Focusing on recommendations about the future rather than explanations about the past also matters.
When you write reports this way, you'll gain executive trust and naturally connect to actual business results.
Recommend contetns
.svg)


.svg)