.svg)

.svg)
%202.svg)
Machine Learning Technology that Enhances the Accuracy and Differentiation of Demand Forecasting AI

The Beginning and Motivation of Demand Forecasting Research
What attracted you to the field of demand forecasting?
I started through my academic advisor during my undergraduate years. While studying how various coding-related technologies could be applied in actual industries, I met my current CEO, who was then a professor involved in projects linked to actual companies. This led me to begin research using real corporate data. I found the field of demand forecasting very challenging yet appealing because it is still an unstandardized area. The fact that it's not an easy field to venture into piqued my curiosity. Demand forecasting is a field that can be expanded in many directions, not just through traditional time series forecasting methods, but also by utilizing relationships between various external variables, and crawling external situation data related to new products. I was attracted to it because it's an area that hasn't been fully researched yet, with endless topics for future study.
What led you to work with CEO Jung Doo-hee?
I thought the CEO was a very passionate and admirable person, both in terms of self-management and academic excellence. While there are many other excellent professors, I heard that some delegate tasks to their students and step back. However, our professor directly intervenes in all processes, takes responsibility until the end, and works even harder than the students. Seeing that, I became confident that I could learn a lot by working alongside him.
Could you briefly introduce your main research areas?
We are developing research methodologies to effectively utilize original data held by companies for demand forecasting. Specifically, we are focusing on data augmentation techniques, developing demand forecasting models using LLM, and researching intermittent demand forecasting methodologies for situations with limited data.
Challenges and Solutions in Client Data Analysis
What was the most challenging technical hurdle when analyzing data from various clients?
Since we deal with various companies, their data, while having commonalities, often have unique structures or express the same concepts differently. This disparity in data structure across clients was the biggest pain point. Standardizing this diverse data for integration into our system and automating the data analysis process was our greatest challenge. As we deal with many different companies, automation is essential. While we haven't achieved 100% automation yet, our biggest current challenge is categorizing the highly varied forms of data to fit our standards and developing appropriate data analysis methods for each category.
What specific difficulties did you encounter during the data normalization process?
Each data set has very different characteristics. Some data has many entries over a short period, some products have irregular patterns of sales and non-sales, while others show annual patterns based on seasons or weekly patterns. Normalizing these diverse data characteristics for system integration was quite complex.
What are Impactive AI's unique strengths that helped overcome these challenges?
We classified and standardized various product data types with our CTO. This task requires close communication between engineers and researchers, as it directly impacts both modeling and how data is displayed in the service. We believe our strength lies in the process of classifying and standardizing data to be efficiently used by both the modeling and system aspects.
Key Strategies for Improving Model Accuracy
What do you focus on most when building models to increase accuracy?
The most important aspect is understanding data characteristics. Each model has unique assumptions, such as the data following a specific pattern. By matching these assumptions with the data classification I mentioned earlier, we can efficiently select the optimal model without trying every single one, thereby improving accuracy.

We also place significant importance on the definition of model accuracy itself. Generally, accuracy is expressed as a percentage of the ratio between the actual value and the prediction error. However, there's a problem when the actual value is 0 and the predicted value is 1, leading to an infinite error. For intermittent items that are not sold every month or week, it's crucial to define an accuracy metric that is easy for the client to understand. We meticulously select from various accuracy definitions, such as whether to calculate absolute error or how accurately the upward/downward pattern was predicted.
How do you overcome differences in data quality and quantity among clients?
We define our own internal standards for quality measurement, setting them at a level understandable to clients to facilitate smooth communication. We establish and apply standards that are easy for both parties to understand without hindering modeling. As clients are increasingly interested in AI and big data, we explain it in terms of the number of data points per item. For instance, if we're predicting for the next 6 months and only have 12 months of historical data based on the number of monthly sales events, it's difficult for model training. We explain data quantity in this manner, and for intermittent sales, we describe whether sales are regular or irregular, and their intervals, using statistical indicators like variance and standard deviation in the simplest possible language. To overcome data scarcity, we also develop and apply time series data augmentation techniques and various derived features in our modeling.
Do you have any tips for communicating with non-developers?
I realized that excessive explanation can be counterproductive. Initially, I tried to convey all my knowledge to achieve the same level of understanding, but I had to consider that meetings are limited to 1-2 hours and clients might not desire such detailed information. I learned that it's more effective to explain only the overall flow concisely, just enough for them to understand the results. Our practical know-how is to explain only enough for them to grasp the big picture, and provide separate materials if more detailed information is needed.
Innovation in Intermittent Demand Forecasting Methodology
How does intermittent demand forecasting differ from general demand forecasting?
General demand forecasting assumes continuous demand and develops methodologies based on that. That is, the primary approach is to predict the quantity of demand, assuming demand exists, rather than whether it will exist. In contrast, intermittent demand forecasting requires two stages of prediction: 'will demand occur?' and 'how much will occur if it does?' Applying existing methodologies directly can lead to inaccurate results, such as assuming continuous demand or abnormal fluctuations in predicted values. One intermittent demand forecasting methodology involves developing separate models for predicting demand occurrence and demand quantity, and then integrating the two results. This approach improves the accuracy of both demand occurrence and demand quantity, thereby increasing overall accuracy as the model handles the two tasks separately.
What differentiates this prediction method?
Since we primarily conduct research based on papers, our analysis of intermittent demand forecasting methodologies from other companies and research institutes revealed that most studies were conducted in data-rich environments. For daily or weekly data, there are about 4 weekly data points or 30 daily data points in a month. However, for the monthly data we handle, only one data point is generated per month, totaling only 12 data points even after a year. Designing complex models with limited data can lead to cumulative errors and degraded performance. We focused on how to overcome data scarcity under the challenging condition of monthly predictions. While other studies focused on improving prediction performance in data-rich situations, our main differentiation is our research on how to maximize the advantages of intermittent demand forecasting methodology even with limited data.
What specific methods do you use to improve prediction performance in data-scarce situations?
We use two approaches. From a data perspective, we are focusing on data augmentation techniques. From a modeling perspective, we are developing models that can effectively learn even with limited data. In this research, we built an intermittent demand forecasting model by combining both data processing and model training approaches.
Innovation in External Variable Generation Using LLM
You mentioned using LLM for generating raw material related variables. How exactly does that work?
There are social issues that affect specific raw materials or items, such as wars and natural disasters. Previously, workers would make judgments based on experience and intuition, like 'a natural disaster in this region will affect this product by this much,' but it was very difficult to apply this to models. It was challenging to standardize due to various events like wars and natural disasters, and new, unforeseen events constantly occurring. Traditional models learn from past data, and there was no way to handle new types of events when they arose. We utilize LLM to collect news articles centered around keywords related to products or raw materials, and then generate related keywords. Next, we let the LLM make a value judgment on whether the event in the article will have a positive or negative impact on the raw material.
What hypothesis did you start with when attempting this approach?
We believed that while LLMs are not completely reliable and don't know all the answers, they are capable of basic judgments at a human level. For example, the hypothesis was that LLMs could automatically process simple yet complex situations, such as what impact a tariff increase might have. We judged that LLMs could sufficiently perform simple value judgments like positive or negative, and that automating this would allow for more efficient and rapid processing of value judgments previously done by humans. Especially since LLMs are language models, they cannot make numerical predictions but can read news articles. Events like wars or pandemics don't exist as quantified data but appear quickly in news. LLMs can read these news articles and create various indicators. These indicators are then used to train our prediction models.
Could you give an example of the kind of indicators that are generated?
We define major issues that can affect raw material prices, such as wars, production facility shutdowns, or politicians' statements, categorized by production area, consumption area, and globally. We quantify these issues into various indicators, using criteria such as intensity and frequency. For example, regarding production-related issues affecting nickel raw material prices, we generate indicators like the frequency of news articles, positive/negative analysis of how each article affects price increases/decreases, the impact intensity of each issue on price, and an impact score combining intensity and frequency.
What are the advantages compared to existing methods?
The biggest advantage is automation. This significantly saves cost and time. Since we developed this for prediction purposes, the main differentiation from existing methods is our ability to quickly and cost-effectively generate external variables with a level of accuracy suitable for prediction.
How much does it contribute to actual prediction accuracy improvement?
We are currently continuously analyzing the research results. So far, accuracy has shown a positive improvement of about 5%. This is still an early stage, meaning we have successfully developed variables that positively influence predictions. Our future goal is to develop this technology further to achieve over 10% improvement. While there might not be a big difference in everyday situations, we plan to measure the extent of improvement by calculating the impact score for specific events and comparing it with cases where it wasn't applied.
What is the ultimate goal you aim to achieve through this research?
The first goal is to improve accuracy. Existing models predict based on the premise that past patterns will continue, making it difficult to detect changes when situations shift. Our first goal is to improve accuracy by reflecting these changes through the impact score. The second is to enhance explainability. Without reflecting rapid changes in external variables, even if we accurately predicted a sudden change, it was difficult to answer clients' questions like 'how was this possible?' If the impact score is reflected in the prediction, we can explain, 'a negative external event occurred, and these are the related events,' achieving both improved predictability and explainability.
What was the biggest technical difficulty you experienced when utilizing LLM?
The greatest difficulty was gaining confidence that the impact score measurement was accurate. Since we had to create something new without a pre-existing standard, finding criteria to determine the accuracy of the impact score was very challenging. Previously, the concept of an impact score didn't exist, so there were no criteria to judge if it was accurately measured. Designing and executing a two-step process was the most challenging part: continuously discussing and setting criteria with researchers to distinguish between hallucinations and genuinely accurate judgments, verifying measurement results based on those criteria, and then confirming the performance when applied to predictions.
How far along is the development of this feature currently?
It is currently in the commercialization preparation phase. Once it is fully developed to a commercialization level and we have confidence in it, we plan to integrate it into Drift Flow.
Model Customization and Customer-Oriented Solutions
How does the information gathering process work to understand client-specific characteristics?
During the data analysis stage, we verify that our understanding of the meaning of each data point, categorized by industry, is accurate. We dedicate ample time to understanding the data itself and the background behind its generation. Based on this understanding, we extract data characteristics using our sophisticated methods. This allows us to identify pain points that make prediction difficult and then select models that can effectively resolve each pain point. In this way, we understand the characteristics of each data set, identify key pain points that might make prediction difficult, and then customize suitable models from our diverse range of models with different assumptions. Additionally, since we utilize external variables, we also analyze which external variables are appropriate for that specific domain.
What criteria do you use to choose between the two model customization methods?
We focus on what problems the model can solve. If existing baseline models can effectively solve those problems, we approach it by applying fine-tuning to the baseline models. If there are problems that are difficult to solve with existing models, we design a new model to address them and research new architectures, such as the intermittent demand forecasting model. Since resources are limited for designing new solutions for every company, we develop models to solve common problems as they arise through our experiences with various companies, along with patent applications. If there are similar pain points, we use our custom-designed model. If the data can be approached with existing models, we use those, effectively utilizing both approaches as appropriate.
What are the pros and cons of each method?
Existing models have the advantage of being verified by many, ensuring stability and quick application. However, their drawback is that they are difficult to use when a client's specific pain points fall outside the scope of existing models. Our custom-designed models take longer, and since they are primarily validated with client data, they are relatively less verified than baseline models. However, they have the advantage of higher prediction performance because they are designed to be most suitable for the specific data characteristics. Therefore, we selectively use both methods depending on the situation.
Do companies in the same industry ever show different characteristics?
If the industry or products sold are similar, they generally show similar macroscopic characteristics. However, each company also has its unique data patterns, leading to differences in specific details. If the structure is similar, such as B2B manufacturers, B2C distributors, or the fashion industry, the major patterns for each industry tend to be similar according to the law of large numbers.
Customer Doubt Resolution and Visualization Strategy
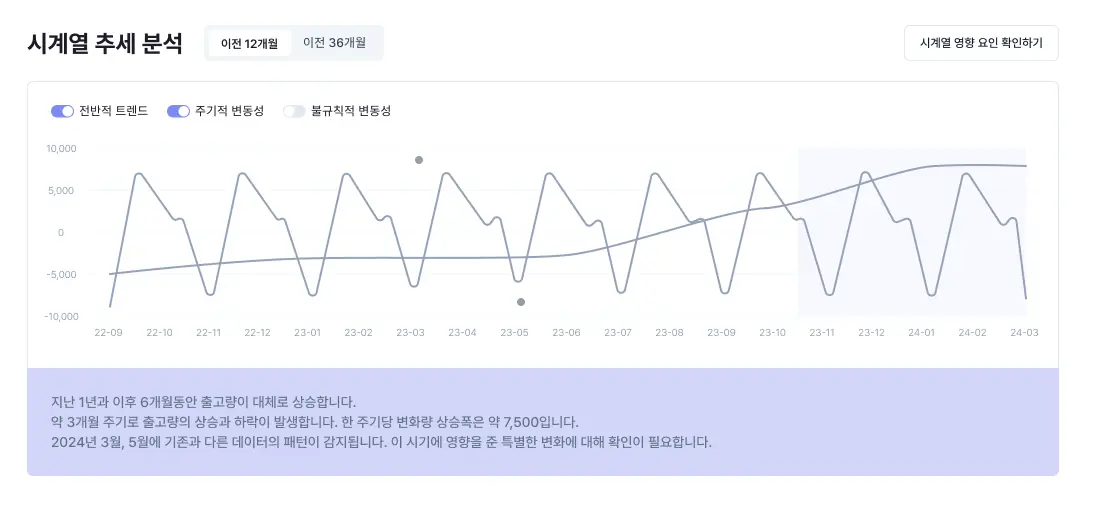
What is your visualization strategy to address client doubts?
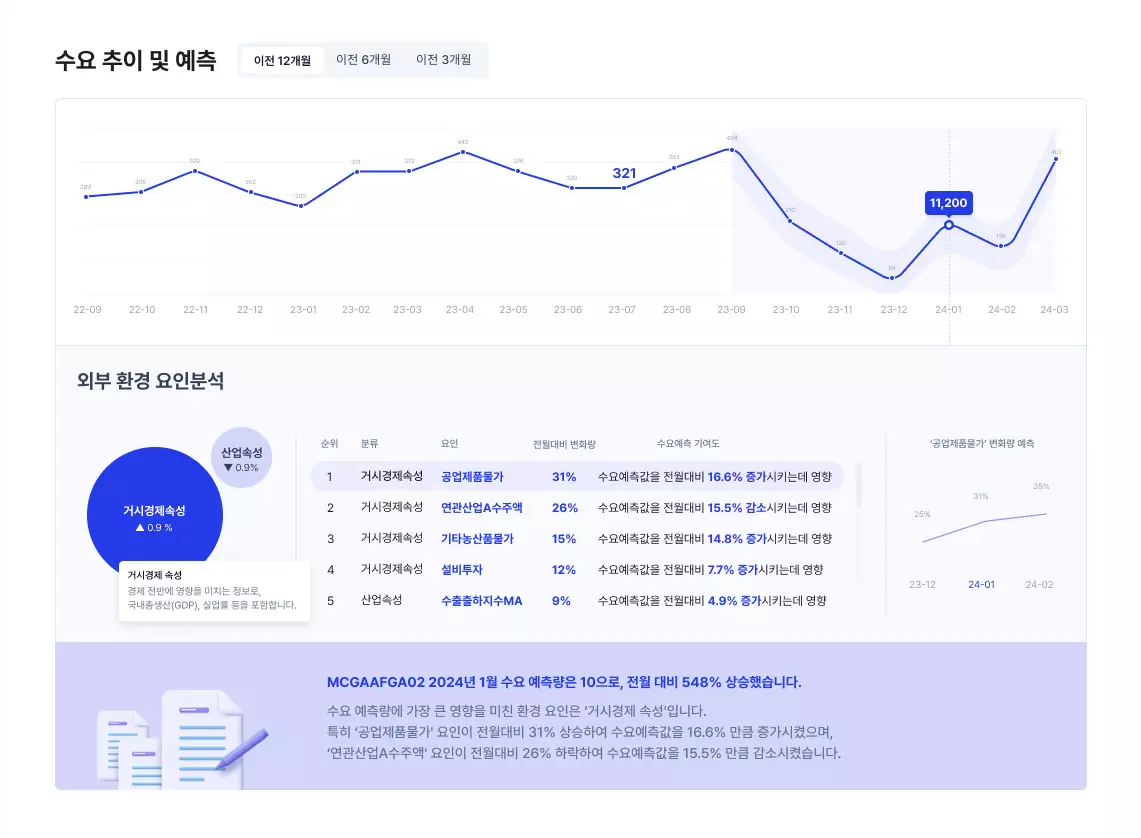
We have a basic reporting framework that can cover most requirements. Generally, we provide graphs comparing past actual values with our predicted values, and explain the accuracy score along with the percentage of accuracy achieved. For cases with many intermittent patterns, we apply different visualizations based on the pain points identified through data characteristic analysis. For intermittent predictions, we visualize how accurately the pattern was captured. When external impact scores have a significant influence, we visually demonstrate the relationship or variability between the impact score and the actual prediction data. This visualization aims to prove that we have successfully overcome the pain points identified during data analysis.
What is the importance of the report format?
How clients receive prediction results is a crucial selling point. In a B2B environment, reporting to superiors is important. If the client's practical staff can use the reports provided by Impactive AI directly without having to write them themselves, it can significantly increase work efficiency. This offers a very valuable proposition to practical staff.
Challenges and Innovations in Explainability
Have you ever encountered difficulties in terms of explainability?
AI explainability becomes more difficult as the model becomes more complex. Our engineers have been explaining from a model perspective, observing the output when a specific input is given to the model, understanding what relationships the model has learned, and how important the model considers each variable. However, for clients who don't trust the model itself, it was difficult to adequately answer the question of 'how do these model-centric explanations connect with our existing work methods?'
How are you solving this problem?
We are approaching it from a data perspective. We explain how the data has certain relationships, how it's related to external variables, how we trained the model with this information, and how these predictions resulted. From the perspective of enabling the model to have a comprehensive understanding of the data, we are continuously researching explanation methods that effectively reflect how clients conventionally understood things.
Do you recall any major failures or unexpected results?
There was a situation where, when automating predictions based on incoming data, assuming the data would continue, we lacked information about items that were no longer being sold. We discovered several cases where our predictions assumed 'this much will be sold in the future,' even though the data showed no sales, because we failed to identify that information. Through such cases, we concluded that instead of receiving separate information about sales status, we should handle it internally. Additionally, when forecasting external raw material prices, we began research into utilizing LLM to improve predictability in situations of rapid changes in external circumstances, particularly recent frequent changes in Trump's tariff policies. These cases are the most memorable. What's important is that we don't leave problems unaddressed; instead, we discuss solutions internally, find them, and develop them into new research topics, which I believe is our strength.
Demand Forecasting Research Efficiency and Automation
How do researchers' experiments and automation module development affect research quality?
As research records accumulate, when sharing knowledge like 'this model is effective in this case' among researchers, if there isn't a standardized method, sharing may not occur properly, or someone might duplicate work already done. To prevent such communication losses, we created a code module that allows models to be generated automatically when data comes in, without needing to write modeling code manually. We developed this to create an environment where new modules and methodologies are continuously developed and shared in a standardized way, allowing other researchers to utilize them with minimal effort.
How did the team members react?
They reacted very positively. Previously, they had to receive code directly for their work, but as the organization grew, we anticipated limitations with this approach. When we provided the automation module, work convenience significantly improved, and actual work speed became much faster. By further developing this, we were able to expand the scope of basic modeling, allowing us to focus on new research while systematically recording previous work in our own library. All researchers are satisfied and actively using it.
Are there any additional developments you'd like to pursue in the future?
Currently, only model experimentation is automated, but I'd like to standardize the method for comparing and analyzing experimental results. Different researchers may focus on different metrics, but standardizing the methodology for comparing and analyzing these diverse experimental results will standardize the quality of prediction results, allowing us to provide stable prediction results to clients regardless of which researcher is involved. Our next goal is to standardize and advance the comparative analysis of prediction results, such as whether a client's prediction results are excellent or which experiment yielded the best performance.
How confident are you in your accuracy compared to other solutions?
Recently, after comparing accuracy with a competitor using identical data from the same company, we achieved at least 3-5% higher accuracy and up to over 10% higher accuracy, depending on data quality. We can confidently say that we can provide clearly superior prediction results within the 3-10% range. The more data there is, the better the model trains, reducing accuracy deviation. However, where we are particularly confident is in our performance in data-scarce situations. While the improvement is 3-5% when additional data is secured, we achieved about 10% improvement in data-scarce situations. Our research focused on challenging prediction scenarios has proven that we can achieve about 10% superior performance compared to other companies in these areas, which gives us confidence.
Are you saying you perform better in data-scarce situations?
That's right. Many companies actually don't have enough data, so I'm satisfied that our research focused on this area has yielded good results.
Vision for Perfect Demand Forecasting
What does perfect demand forecasting look like?
I believe it should be perfect from the client's perspective. From our perspective, results that we considered satisfactory after adding and applying various methodologies sometimes felt completely different to the client or lacked smooth communication. I believe perfect prediction means the client feels it is perfect. To achieve this, we aim to enhance explainability and increase the range of usable variables so that clients can trust and utilize the prediction results in their actual work. This is what I consider perfect demand forecasting. Impactive AI hasn't reached perfection yet, but we are clearly defining what perfection means and continuously striving to achieve that goal.
What was your most rewarding moment during your research?
I felt a great sense of accomplishment whenever we received feedback that our prediction results were superior to other companies. As I conduct research to derive prediction results, the moment I gain confidence that 'I am doing good research' is the most rewarding. The clear display of results is both an advantage and a burden. Since it's immediately reflected in scores, there was considerable pressure, making it difficult to sleep initially. There was an anxiety about having to provide predicted values without knowing the correct answers. However, the CEO's recognition of my hard work and his focus on identifying the cause when results weren't good, without criticism, gave me the strength to persevere.
Do you have a personal philosophy or approach in the field of demand forecasting?
In demand forecasting, I hold the view that 100% perfect prediction is impossible. Focusing on improvement over the existing methods actually made me more comfortable and allowed me to concentrate on how to achieve improvement. Our goal is to provide more accurate predictions than before. Even if it's not perfect, improving accuracy from 40% to 60-70% is a great help to the client. By letting go of the desire for 100% perfect prediction and focusing on how much we can improve, I was able to concentrate more on solving the problems clients faced. The area that still needs further development is explainability.
What new research directions do you personally want to challenge?
I want to conduct research that allows us to use complex models while ensuring clients can trust the results, and to generate reports that reduce communication resources when reporting to superiors.
How do you envision Impactive AI's prediction technology and your personal self in three years?
By increasing the efficiency of our ongoing automation research, I aim to build a system in three years that can produce high-quality initial prediction results from data collection without human intervention. Personally, I want to evolve from a researcher to an engineer who can contribute to effectively building such automation processes and designing systems.
Lastly, a word to your teammates?
All our team members work incredibly hard in their respective roles, and I learn a lot from observing them. I'm grateful to be in an environment where there is so much to learn. I feel grateful to my teammates.
Impactive AI is striving to create a perfect demand forecasting solution that goes beyond simply improving prediction accuracy, enabling clients to trust and utilize it in their actual work. By leveraging intermittent demand forecasting methodologies that perform well even with limited data, and innovative approaches using LLM, we are opening new horizons in demand forecasting AI technology. As seen in researcher Ryan's story, it is evident that Impactive AI is an AI company that creates true value through a combination of technological innovation and customer-centric thinking.
.svg)
.svg)
.jpg)


See It for Yourself.


