.svg)

.svg)
%202.svg)
The present and future of advanced demand forecasting models

As uncertainties in the global supply chain increase, the importance of demand forecasting and inventory management for companies is greater than ever. In particular, the need for accurate demand forecasting throughout the entire process, from raw material supply to finished product inventory management, is increasing in the manufacturisng and distribution industries.
However, traditional demand forecasting methods have shown their limitations in that they rely solely on past data. This is especially true when it comes to responding to unpredictable situations or rapid market changes such as COVID-19.
Moreover, a uniform approach that fails to reflect the different characteristics of each industry and company has been a constraint on the creation of practical business value.
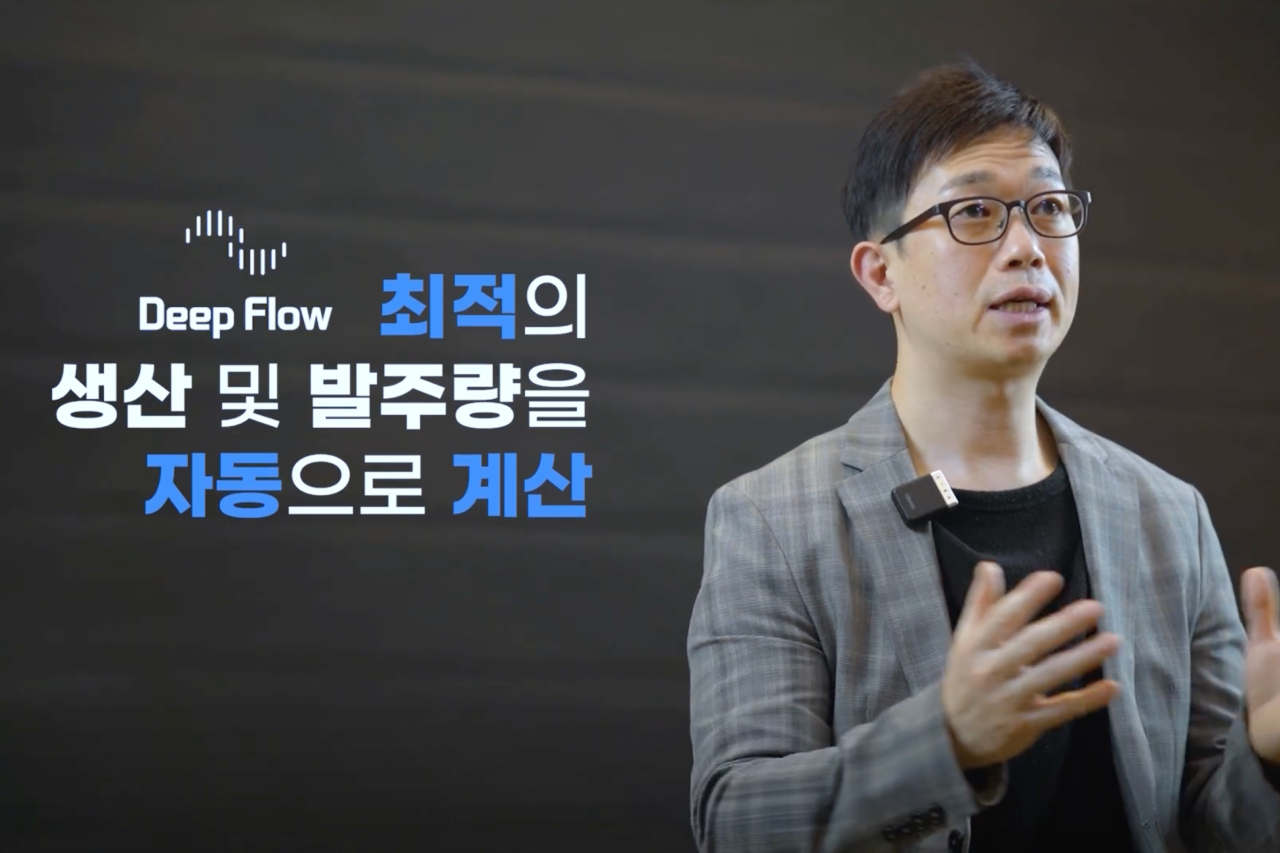
IMPACTIVE AI has developed deepflow, an AI-based demand forecasting solution specialized for the industry, to solve these problems. What is particularly noteworthy is that it goes beyond simple demand forecasting to provide customized insights for each company and helps practitioners make decisions by increasing the explainability of the forecasting results.
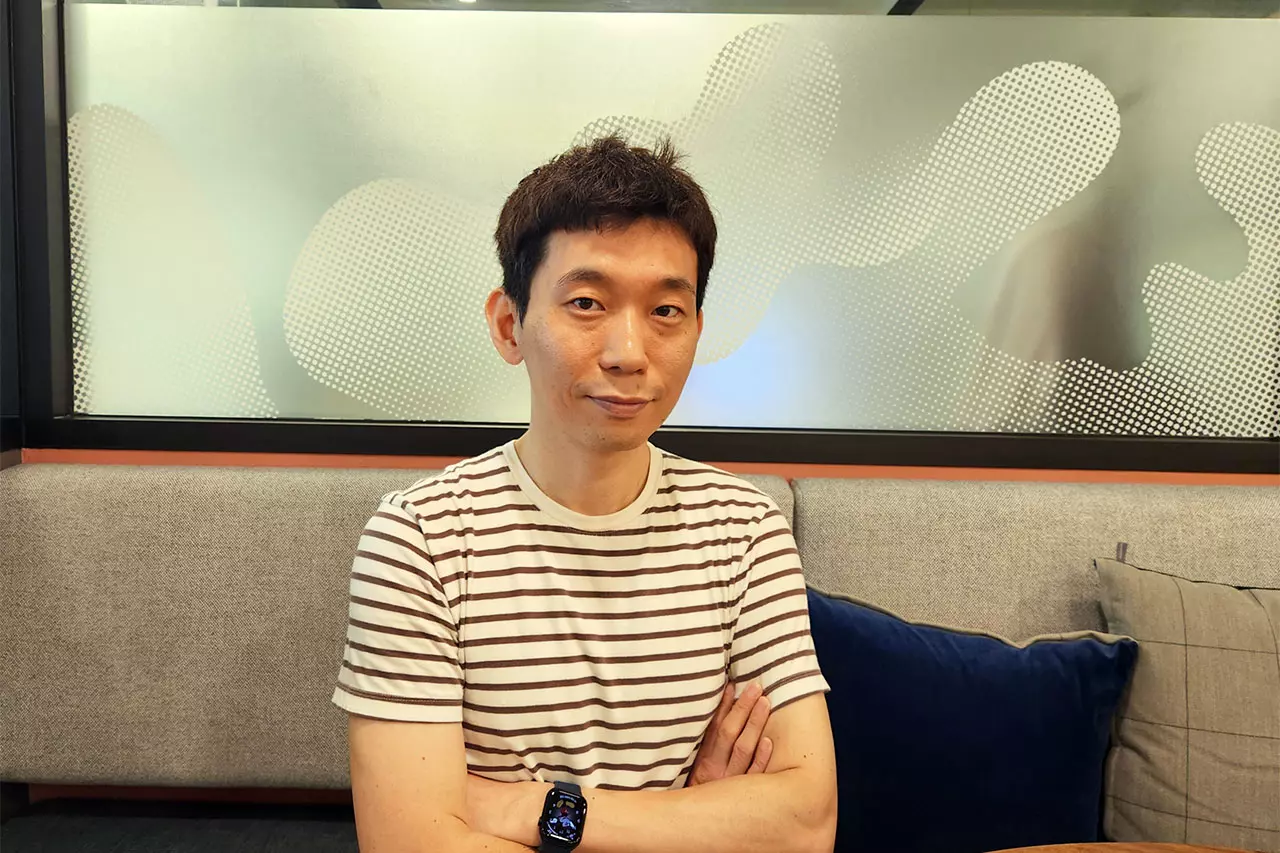
As a founding member of IMPACTIVE AI, Yoon Jin-seop has led the development of Deepflow's core technology for two and a half years. An expert in the field of time-series data augmentation, he is currently in charge of developing predictive models and preprocessing data for AI systems.
In this interview, we will take a deep dive into the technical features and differentiators of Deepflow, the latest research trends in the demand forecasting field, and the future of AI-based demand forecasting.
Technical strengths of the demand forecasting solution, Deepflow
What are the unique technical strengths of Deepflow?
Deepflow has two key approaches that differ from the prediction methods of existing companies.
The first is the model aspect. In the past, we simply predicted future sales based on past data, but now we select the optimal model for the characteristics of the data and use it to improve the accuracy of the prediction.
The second is the data aspect. We currently use about 2,000 external data features, and we create the optimal prediction scenario through various combinations of these features.
For example, in some feature combinations, the model performance is this, and in other combinations, it is another result. We automatically test and evaluate all of these cases to find the optimal combination.
What is the difference between Deepflow and other open source models?

Deepflow is developing industry-specific models, unlike general models.
For example, in the steel industry, we analyze various market data, including raw material price trends, sales patterns, and inventory data, as well as macroeconomic indicators that affect raw material purchases and production. Through this, we create models specific to the steel industry.
We are also continuously developing our model by incorporating customer feedback. We collect data on factors that affect sales volume or ordering, and inventory management and ordering process characteristics, and reflect them in the model.
This enables us to implement a data-driven approach that can effectively respond to situations with high volatility.
What are the advantages of Deepflow compared to demand forecasting based on the Foundation model?
When evaluating a foundation model, you should first look at what data has been used to prove its performance. Most of them use weather data, macroeconomic data, and electricity demand data, which are very different from the actual sales data of a company.
In particular, B2B data rarely has the characteristics of a typical time series because sales are made through contracts and sales volume is determined according to the pattern of the ordering company.
Some days, 2,000 units are sold, then suddenly 8,000 are sold, and sometimes there are days when no units are sold at all. This irregular pattern is not suitable for a typical foundation model.
Even in the case of B2C data, there are rapid increases and decreases due to promotions, and the patterns differ from company to company and promotion to promotion. Considering these characteristics, we are conducting research in the direction of developing foundation models specialized by industry.
Demand Forecasting Leader, Advancement of Deepflow
What research projects are currently underway?

We are conducting research in four main areas. The first is an automatic data pattern analysis system. We are developing technology that automatically diagnoses data trends, seasonality, volatility, and sales, and matches the model optimized for each pattern.
Currently, an alarm is triggered when the model performance drops, and the model is re-trained. In the future, we plan to build an automatic matching system between data patterns and optimal models to more efficiently select the optimal model for each item.
The second is risk prediction and simulation modeling. For example, we are developing a decision support module that responds to internal and external risks by predicting the impact on a company in situations such as a sharp rise in exchange rates or a decline in external credibility and suggesting appropriate inventory levels.
In addition, we are trying to move away from the traditional quantitative approach and take a problem-oriented approach.
For example, the demand patterns vary greatly from product to product. Some products are sold consistently on a monthly basis, while others are sold intermittently over a period of two to three months. We are studying which model is best suited to each of these patterns.
We are also studying forecasting methods for cases where there is a lack of data, such as new products. Developing an optimized approach based on the characteristics of the problem is currently our main research direction.
How are you developing your data preprocessing methods?
We are approaching data preprocessing from five main aspects.
The first is a policy for dealing with missing values, the second is a method for dealing with outliers, and the third is a feature processing method. For example, in the case of sales volume data, the sales volume or average value at the previous point in time can be an important variable.
In addition, macroeconomic indicators are not simply used as raw data, but are processed appropriately. In the case of exchange rates, the fluctuation range at each point in time is used as an input variable.
Appropriate transformation of the target variable is also important. If the volatility is too high, the model may not be able to identify it well, so it is processed through processes such as normalization and standardization.
I heard that you are also conducting research on data augmentation.
My doctoral dissertation was on data augmentation, and I studied augmentation methods that take into account the characteristics of time series data. It is important to design the augmentation method so that it can capture temporal dependencies well, rather than simply increasing the data.
In particular, when the data pattern is unstable or the amount of data is small, I developed a prediction framework that combines data augmentation and a deep learning model as a method to solve this problem.
Based on this technology, we were selected for the Deep Tech TIPS program, and we are currently continuing to research augmented models that fit the characteristics of time series data.
What is your outlook on the future direction of time series forecasting?
Currently, I am focusing on the direction of advancement of transformer models.
The time series forecasting field has been slower to adopt new technologies than other AI domains. For example, transformer models were only applied to time series models two or three years after their introduction.
In particular, we are conducting research to simultaneously improve short- and long-term forecasting. This is done by combining architectures specialized in long-term forecasting and those specialized in short-term forecasting in a hybrid manner.
Through this, we aim to effectively capture both the short-term uncertainties and long-term patterns that arise from demand forecasting.
The challenge of explainable AI
What was the background for building explainable AI?
Deepflow aims to not only provide a prediction, but also to present the process and rationale behind the result.
While the approach used to date has focused on the prediction and model performance, we are now evaluating how much these external indicators actually affect the company or industry by decomposing them into time series characteristics.
For example, when there is a change in the exchange rate, we analyze how this change affects the actual industry with a certain time lag. This allows us to filter out variables that have a significant impact on the actual industry and create a model by evaluating the combination of features based on these variables.
This increases interpretability and improves the performance of the model.
What are the main research directions for increasing interpretability?
We are approaching this from two main directions. The first is to interpret the process by which the model derives its predictions, and the second is to identify the factors that have a causal impact on actual sales volume.
Last year, we developed a feature that explains the model's prediction process, and this year, we are focusing on research to identify features with causal influence.
We are using the causal discovery methodology to identify causal relationships between variables and are creating a structure to select predictive variables based on this. Through this, we aim to improve the explainability and prediction accuracy of the model at the same time.
What value does explainable AI provide to real businesses?
The fundamental reason why companies make demand forecasts is to reduce uncertainty. From this perspective, we are implementing modeling that goes beyond simply providing forecast values to predict and simulate various risk factors.
For example, you can create a scenario to see how a sudden spike in the exchange rate or a drop in foreign credibility will affect your company.
You can also suggest how to maintain an appropriate inventory if the supply chain for raw materials becomes unstable. This ability to support decision-making based on internal and external risk factors is the core value of explainable AI.
What were the difficulties you encountered in the process of increasing interpretability?
As we created services using AI technology, the biggest challenge was to explain the technical details in an abstract way. For example, when using methodologies such as SHAP value or Feature Importance as feature selection methods, it was not easy to explain how these methods differ and what the output means.
To solve this problem, we have adopted a method of explaining it based on real-life examples. We are trying to explain the model's prediction process and results step by step using real data from specific industries or companies, and we are striving to explain it in a way that even non-experts can understand.
Collaboration and organizational culture
What is the organizational culture of IMPACTIVE AI?
We work in a very free atmosphere. Communication is also mainly done freely through Slack. The organization is largely composed of a planning team, a product team, and a development team, and each team works together organically to carry out projects.
In particular, our senior-level employees include experts from academia. Director Chan-Gil Hong (CSO) studied computer science at the University of Pittsburgh and has researched neural network models, and Director Hye-Bong Choi (CDO) is also conducting research in the field of data science.
Thanks to the leadership with a solid academic background, a research-oriented culture has naturally been formed.
How is collaboration between teams carried out?
There is a set process for developing new AI modules.
First, the research team conducts verification, and based on the results, the development team defines the specifications. Once the flow is created according to the defined specifications, it is verified in the experiment portal, and finally the module is installed.
The KPI defined by the planning team and user experience-related requirements are also considered important. Several teams are working together to make it easier for users to use the service.
This process requires a lot of communication, but fortunately, all team members are well-versed in AI, which makes communication smooth.
How is knowledge shared?
We regularly hold in-house technical sessions called 'Demand Dinner'. Here, we share what each of us is researching. For example, if I'm researching time series data augmentation, I'll share what purpose I'm conducting this research for, what problems it can solve, and what my future plans are.
At the beginning of each year, we each make a modeling research plan and have time to share it. The research results from this are used to file for patents or submitted to overseas journals and conferences depending on the situation. We share and develop research results in this way.
Are there any conflicts of opinion between developers and planners?
Researchers can be seen as acting as a bridge between planning and development. For example, when we developed the interpretability feature last year, I conducted research during the process of adding a feature that was not there initially, and the planning team standardized and organized the meaning of the results.
Next, we verified that the results from our methodology mapped well with this standard, and tested whether users could intuitively understand it by implementing it on the actual screen.
After verifying on the experiment portal and testing with actual data, we receive customer feedback and discuss the direction of improvement with the planning team. This is how we collaborate.
What advice would you give to juniors who dream of becoming AI researchers?
If you want to become a researcher in the field of demand forecasting or inventory management, the ability to define problems is the most important. This is because even the same demand forecasting may have different practical problems to solve for different industries and companies.
To do this, you need three competencies.
First, the technical ability to understand the principles of algorithms and models and implement them in real-world problems, second, the analytical ability to identify and design factors that affect the needs of industries and companies, and finally, the initiative and interest in solving these problems.
If you develop these three things in a balanced way, you will be able to become a good AI researcher.
.svg)
.jpg)
.svg)


See It for Yourself.


