.svg)

.svg)
%202.svg)
%201.svg)
How Much Does a Demand Forecast Error Really Cost? Why Better MAPE Doesn't Always Reduce Stockouts or Inventory Waste
When a demand forecasting project comes to an end, the final report usually highlights improved numbers. MAPE has fallen by several percentage points, and forecast errors for certain product categories have been reduced.
Yet when financial results are reviewed a few months later, something unexpected often emerges. Forecast accuracy has clearly improved, but lost sales caused by stockouts, excess inventory sitting in warehouses, and end-of-season write-offs remain largely unchanged.
The reason is straightforward. Forecast error and the cost of forecast error are not the same thing.
For SCM professionals, the real issue is not how many percentage points the forecast missed by. What matters is whether that error resulted in stockouts, excess inventory, markdowns, or product disposal. Even the same 10% forecast error can lead to completely different financial outcomes depending on which SKU it occurred in, whether the forecast was too high or too low, and when the error occurred.
So, what does a 10% demand forecast error actually cost?
Let's look at a simple example.
How a 10% Demand Forecast Error Can Become an Annual Cost of KRW 6 Billion
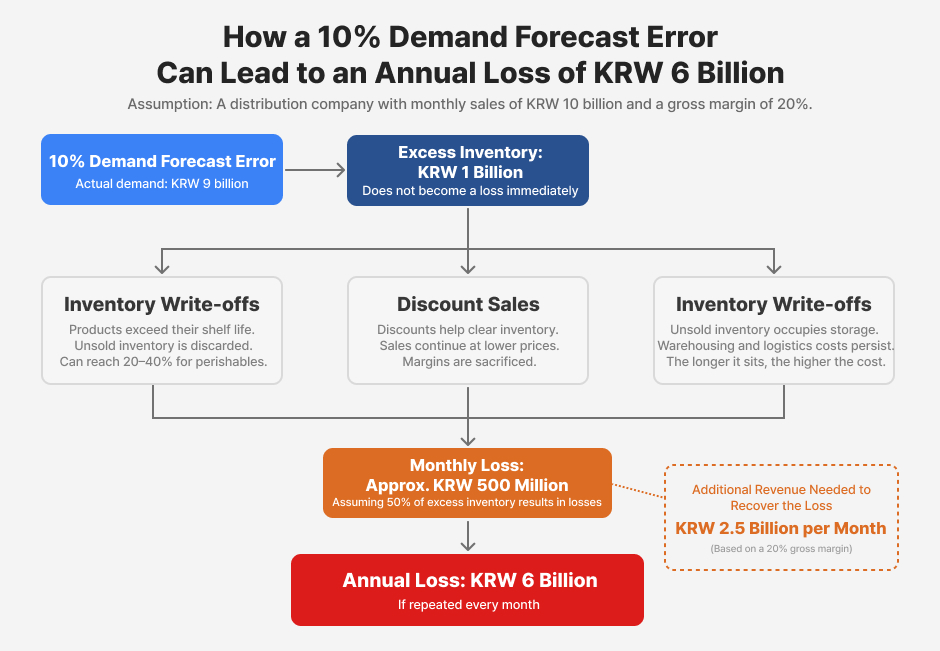
Assume a food distribution company with monthly sales of KRW 10 billion. If demand is overforecast by 10% and actual demand turns out to be only KRW 9 billion, approximately KRW 1 billion worth of excess inventory is created.
That KRW 1 billion does not immediately become a loss. But neither does it simply disappear.
- Some of the inventory exceeds its shelf life and must be discarded. For fresh food products, disposal rates can reach 20–40%.
- Some of it is sold at discounted prices. Although inventory levels decline, profit margins are significantly reduced.
- The remainder stays in storage, continuing to generate warehousing, logistics, and capital carrying costs.
Together, these three channels determine the actual financial loss created by the excess inventory. For the sake of this example, let's assume that loss amounts to roughly half of the inventory value, or KRW 500 million per month.
Now let's take the calculation one step further. If the company's profit margin is 20%, recovering a monthly loss of KRW 500 million would require approximately KRW 2.5 billion in additional sales. In other words, an entire month's worth of sales effort can be wiped out by a single forecasting error. If this loss continues month after month, it adds up to KRW 6 billion per year.
Of course, these figures are only illustrative. The actual financial impact varies depending on product margins, lead times, disposal rates, and inventory policies.
The important point is not the number itself, but the mechanism behind it. Forecast errors do not end as percentages on a dashboard. They eventually flow through stockouts, excess inventory, markdowns, and write-offs before appearing on the income statement.
That is why forecasting performance should be evaluated not only by asking "Has forecast accuracy improved?" but also "Have we reduced the points where forecast errors turn into costs?"
Why Forecast Accuracy and Inventory Costs Don't Always Move Together
If forecast accuracy improves while inventory costs remain unchanged, the forecasting model is not necessarily the problem. More often, it is because these two metrics measure fundamentally different things.
There are three primary reasons why forecast accuracy and forecast error costs become disconnected.
First, the direction of the forecast error matters. Metrics such as MAPE treat a 10% underforecast and a 10% overforecast as errors of equal magnitude. Financially, however, they are far from equivalent. Underforecasting leads to stockouts, lost margin, expedited purchasing, and emergency shipments. Overforecasting results in excess inventory, carrying costs, markdowns, and write-offs. For high-margin strategic products, the cost of underforecasting may be significantly greater. For products with short shelf lives, overforecasting is often much more expensive. Traditional accuracy metrics cannot capture these differences because they do not distinguish between the direction of the error.
Second, forecast accuracy treats every SKU equally, but costs do not. In an overall MAPE calculation, the forecasting error of a low-volume, low-margin product carries almost the same weight as the error of a high-volume, business-critical SKU. In reality, their financial impact may differ by dozens of times. It is therefore entirely possible for overall forecast accuracy to improve because long-tail SKUs become more accurate, while the few products responsible for most inventory costs continue to experience significant forecasting errors. This is one of the most common reasons dashboards look better while financial results do not.
Third, the timing of the error matters just as much as its size. During normal operations, a 10% forecast error may be absorbed by safety stock with little operational impact. During a seasonal transition or immediately after a promotion, however, that same 10% error can translate directly into stockouts or obsolete inventory. An overforecast near the end of a product's selling season is particularly costly because there is little opportunity left to recover the inventory through future demand. Monthly average forecast accuracy smooths over these timing differences, making them difficult to identify.
Ultimately, forecast accuracy measures how far the forecast deviated from actual demand, while forecast error cost measures how expensive that deviation was.
To connect the two, forecast errors must be evaluated together with three additional dimensions: direction, SKU importance, and timing. Only then can forecast accuracy be translated into its true financial impact.
Three Ways Demand Forecast Errors Turn into Costs
Demand forecast errors generally occur in two directions. When actual demand exceeds the forecast, the result is underforecasting. When the forecast exceeds actual demand, it becomes overforecasting. Underforecasting is likely to lead to stockouts, while overforecasting typically results in excess inventory.
In practice, however, these two problems are rarely isolated. A company may rush to replenish inventory after an underforecast, only to find that the delayed shipment becomes excess inventory the following month. In other cases, one sales channel experiences stockouts while another warehouse is left holding unsold inventory.
1. Stockout Costs
Stockout costs arise when inventory is insufficient to meet actual demand. However, not every unit of unmet demand translates directly into lost revenue. Some customers purchase substitute products, while others postpone their purchases until a later date.
Stockout Cost = Stockout Quantity × Contribution Margin per Unit × Lost Sales Rate + Emergency Response Costs
The lost sales rate represents the percentage of stockouts that ultimately become lost sales. Emergency response costs may include expedited purchasing, express shipping, production schedule changes, or other costs incurred to recover from the shortage.
2. Excess Inventory Carrying Costs
Excess inventory is more accurately defined as inventory that exceeds the target inventory level or safety stock, rather than simply inventory that remains unsold. The appropriate inventory level varies depending on lead time, service level targets, and minimum order quantities.
Excess Inventory Carrying Cost = (Ending Inventory − Target Inventory) × Unit Cost × Carrying Cost Rate × Holding Period
The carrying cost rate may include warehousing expenses, insurance, inventory management costs, and the cost of capital. Target inventory should ideally be determined by considering both safety stock requirements and expected demand during the replenishment lead time.
3. Markdown and Write-off Losses
For products with short shelf lives or strong seasonality, excess inventory often results in markdowns or inventory write-offs. In these situations, the analysis should go beyond inventory value alone and consider both the margin that could have been earned at full price and the amount of value that can still be recovered.
Markdown Loss = Quantity Sold at Discount × (Contribution Margin at Regular Price − Contribution Margin at Discounted Price)
Write-off Loss = Quantity Disposed × (Unit Cost − Recoverable Value) + Disposal Costs
Recoverable value refers to any amount that can still be recovered through resale, returns, or reprocessing. In industries where disposal itself incurs additional costs, those expenses should also be included.
Why the Same 10% Forecast Error Has Different Costs Across SKUs
Even when forecast accuracy is identical, the financial impact varies significantly from one SKU to another. Unit price, profit margin, lead time, shelf life, substitutability, and supply stability all influence how expensive a forecasting error ultimately becomes.
The same 10% underforecast can create substantial opportunity costs for a high-margin strategic product because of lost sales. For a low-margin product, on the other hand, emergency replenishment costs may outweigh the value of the lost sales themselves.
A 10% overforecast also carries different consequences depending on the product. Durable goods with long product life cycles primarily generate inventory carrying costs. Food products or highly seasonal items, however, are much more likely to incur markdowns and write-offs in addition to inventory holding costs.
When prioritizing improvements in demand forecasting, organizations should therefore evaluate not only forecast accuracy, but also the financial impact associated with each SKU.
What SCM Teams Should Monitor Beyond Forecast Accuracy
For SCM teams, calculating the cost of forecast errors should not end as a reporting exercise. These figures should be used to refine future ordering decisions and inventory management policies.
For SKUs where stockout costs are high, forecast accuracy alone is not enough. Service level targets and safety stock policies should also be reviewed. Even with the same 10% forecast error, carrying slightly more inventory may be the more cost-effective strategy if a stockout is likely to result in delayed deliveries or customer churn.
Conversely, for SKUs with high excess inventory costs, companies should reexamine their ordering cycles, minimum order quantities (MOQs), production lot sizes, and warehouse allocation strategies. If a small overforecast consistently leaves inventory sitting idle for long periods, reducing order sizes or shortening replenishment cycles may deliver greater benefits than simply improving forecast accuracy.
Inventory imbalances across warehouses should also be monitored. A company may have sufficient inventory overall while still experiencing stockouts in specific regions or sales channels. In these situations, the problem often lies not in total demand forecasting but in inventory allocation. Instead of relying solely on overall SKU forecast accuracy, organizations should also evaluate forecast errors by warehouse or channel, together with the cost of inventory transfers.
After calculating forecast error costs, SCM teams can use the following questions to evaluate whether their operating policies are aligned with financial outcomes.
- Which SKUs generated the highest forecast error costs last month?
- Are stockout-critical SKUs being managed separately from SKUs with high write-off risk?
- For SKUs with high excess inventory costs, are MOQ, ordering frequency, and production lot sizes reviewed together?
- Are inventory imbalances across warehouses or channels contributing to unnecessary stockout costs?
- Is historical forecast data retained so that forecasts can be compared with actual demand?
- During S&OP meetings, are stockout costs, excess inventory value, and write-off risk reviewed alongside forecast accuracy?
Why Maintaining Forecast History Matters
Calculating the financial impact of forecast errors requires more than actual sales and inventory data. Organizations must also retain the forecast values that existed at the time decisions were made.
Many companies keep detailed records of actual sales while failing to preserve historical forecasts. Without them, it becomes difficult to answer fundamental operational questions such as, Why did this stockout occur? or Why does this SKU repeatedly accumulate excess inventory? When only the outcomes remain, root cause analysis often depends on people's memories or meeting notes rather than objective data.
Historical forecast data makes it possible to see what demand the model predicted at a given point in time, how far that prediction deviated from actual demand, and how that deviation translated into financial costs. It also allows organizations to identify recurring forecasting patterns for specific SKUs or sales channels.
Forecast history is more than a record of past predictions.
It is an operational asset that enables organizations to trace how forecast errors evolve into business costs.
High-Risk SKUs AI Demand Forecasting Should Identify First
When companies adopt AI demand forecasting, the primary expectation is usually improved forecast accuracy. In day-to-day operations, however, a small improvement in accuracy is often less valuable than identifying forecast errors before they grow into significant business costs.
If a particular SKU is consistently underforecast, safety stock policies may need to be adjusted. If a specific sales channel repeatedly experiences overforecasting after promotions, the underlying demand patterns should be reexamined. If products with short shelf lives frequently accumulate excess inventory, ordering policies should account for the risk of markdowns and write-offs rather than relying solely on forecast accuracy.
AI demand forecasting should not stop at predicting how many units will be sold next month. It should also reveal how far forecasts deviated from actual demand, how those deviations translated into financial costs, and what operational decisions should change in future purchasing and inventory planning.
As discussed earlier, the example of a 10% demand forecast error leading to an annual cost of KRW 6 billion is simply an illustration. The actual financial impact differs from one company to another, and there is only one reliable way to determine that number: calculate it using your own sales and operational data.
Impactive AI offers a free AI demand forecasting proof of concept (PoC) based on each company's actual business data.
Evaluate your products using your own historical data, compare forecast accuracy with your current forecasting approach, and quantify how improvements translate into lower stockout, excess inventory, and inventory write-off costs.
.svg)


.svg)






%201.svg)
%202.svg)


.svg)