Sold Out on Black Friday? Here's How Much Demand You Missed
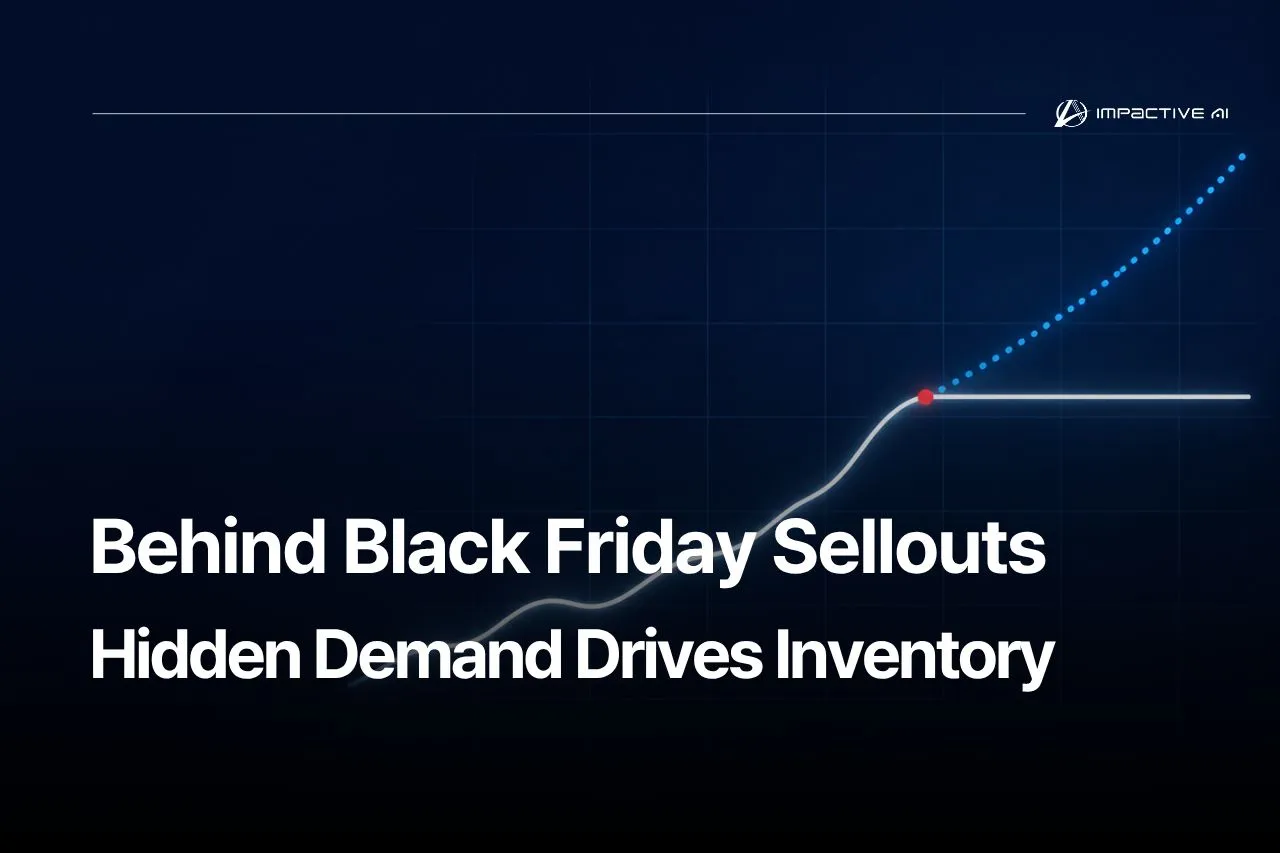
Say you stocked 1,000 units ahead of Black Friday and sold through all of them on the first day. On the surface, that looks like a perfectly sized buy. But if you ran out by mid-afternoon, every customer who came looking after that point never shows up in your numbers.
November isn't just about Black Friday. It's also one of the busiest months for online shopping in Korea. According to Korea's Ministry of Data and Statistics, online shopping transactions reached KRW 24.16 trillion in November 2025, up 6.8% year over year. In the U.S., online spending on Black Friday 2025 alone hit $11.8 billion, a 9.1% increase from the previous year.
When demand spikes like this, inventory often sells out faster than planned. In this article, we'll look at how to estimate how much demand you lost to stockouts when you're working with a fixed allocation, as you are for Black Friday.
Does a Black Friday sellout reflect true demand?
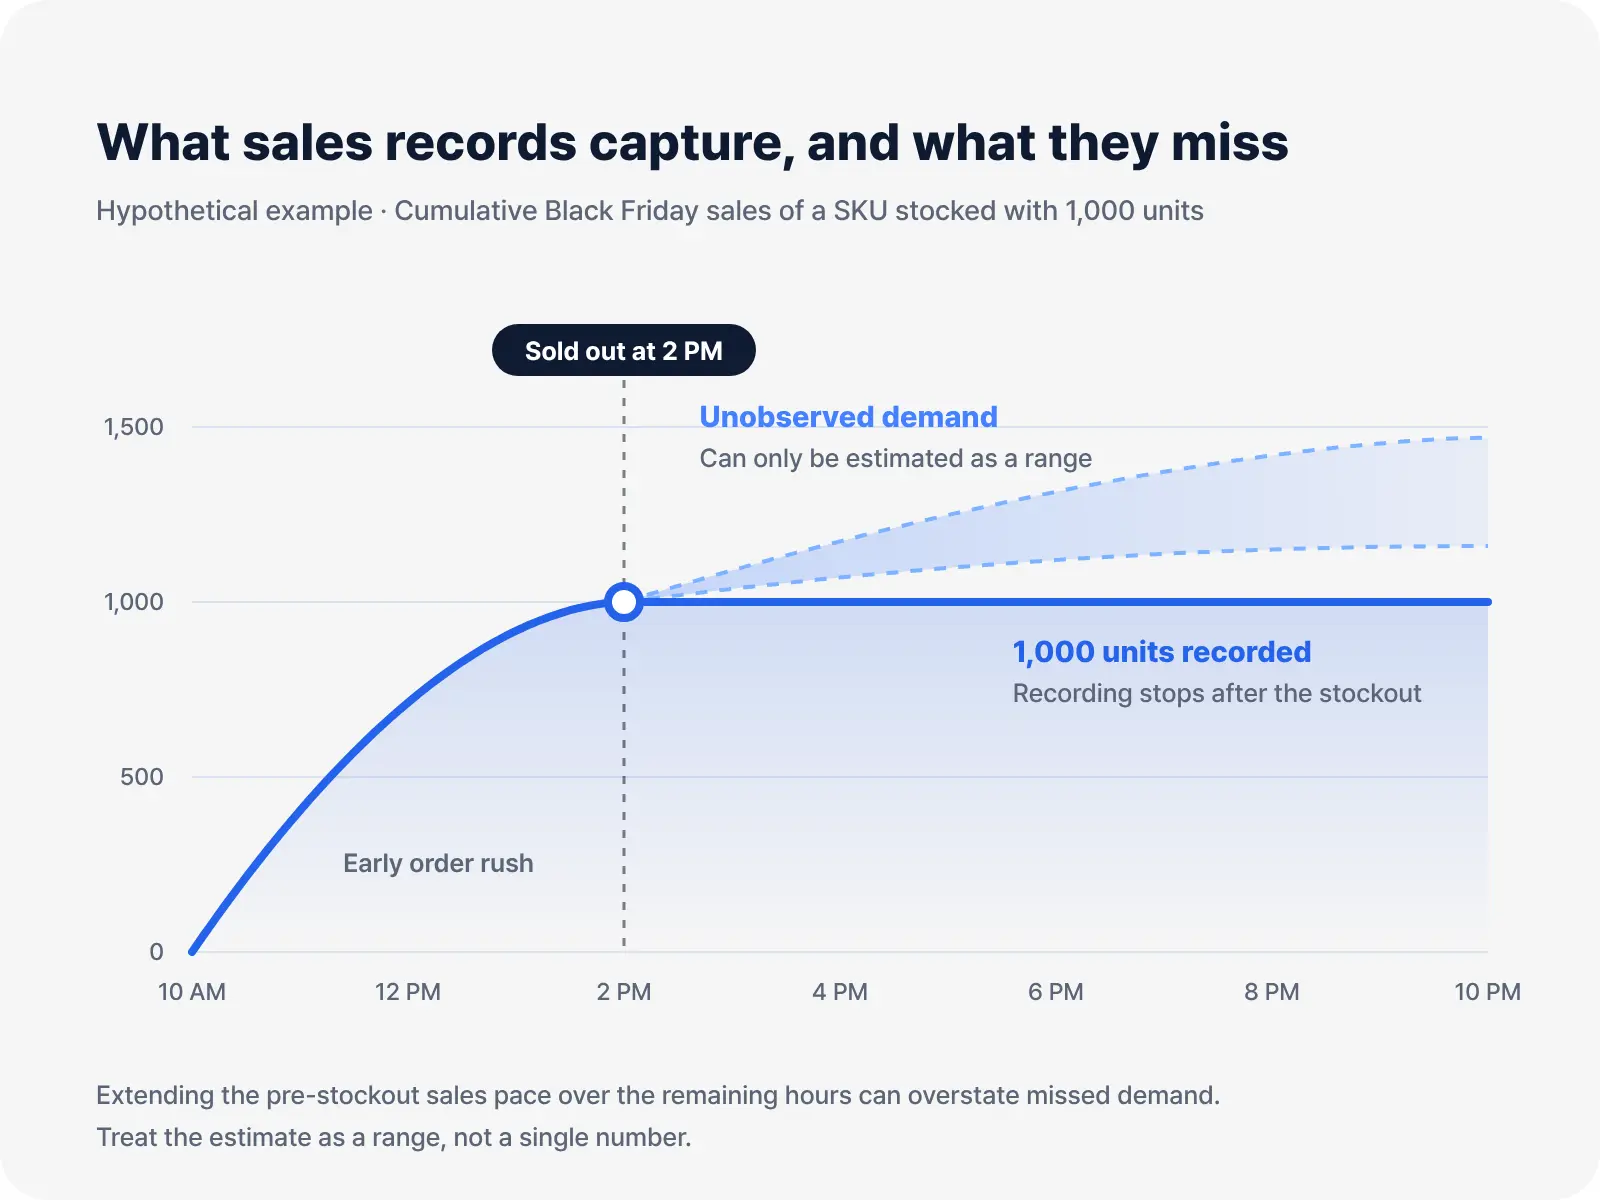
In demand forecasting, the situation where inventory constraints cap observed demand at the number of units sold is called censored demand. Because demand that arrives after inventory runs out can't be directly measured, sales data alone can never fully capture true demand. That's the basic premise of research in this field.
The gap gets wider when system inventory doesn't match what's actually on the shelf. One study of a specific product category at a major U.S. retailer estimated that lost sales due to stockouts came to roughly 3.0% once uncertainty in on-shelf availability was factored in. Calculated from inventory records alone, the figure was just 0.2%. The finding applies to a single category, but it shows how relying on recorded inventory can lead you to significantly underestimate lost demand.
Events like Black Friday, where traffic surges in the opening hours, also tend to push stockouts earlier. And the earlier you stock out, the longer the window of demand that goes unrecorded.
How lost demand creates a stockout loop
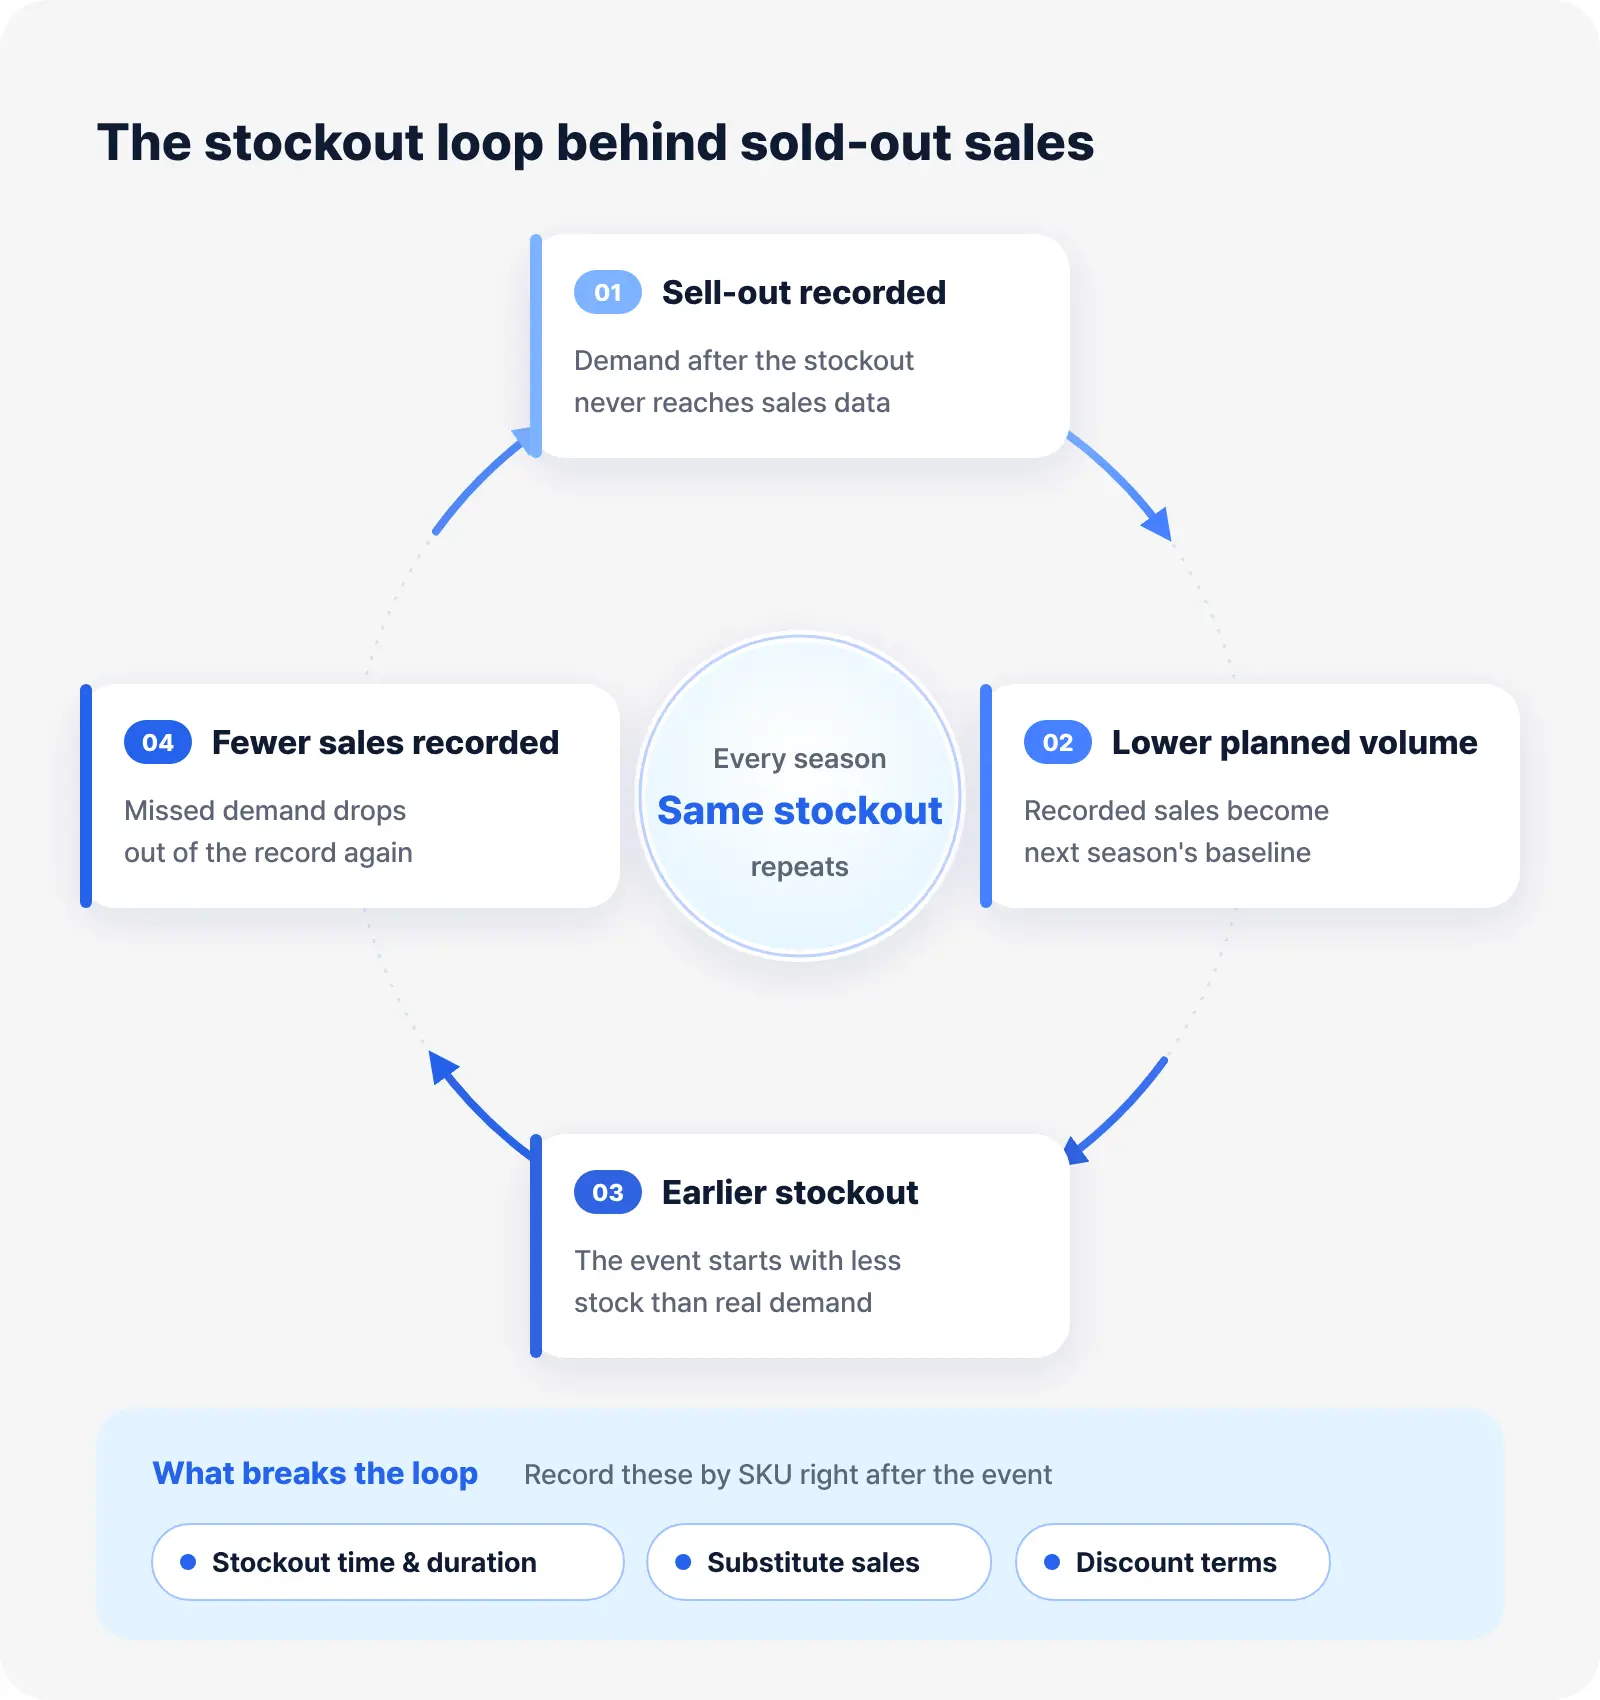
Missing the demand you lost to Black Friday stockouts can trap you in a stockout loop. If you carry a sold-out item's sales figure straight into next season's baseline, your planned quantity is likely to fall short of real demand. That leads to more stockouts and more lost sales. And when those depressed sales numbers become the basis for the following season's plan, you end up in a cycle where stockouts repeat year after year.
Customers also respond to stockouts in very different ways. A 2002 GMA study of 71,000 consumers across 29 countries found that when shoppers encountered an out-of-stock, 31% bought the same item at another store and 26% switched to a different brand. Another 19% chose a different product from the same brand, 15% delayed the purchase, and 9% didn't buy anything at all.
The study focused on in-store purchases of household goods in 2002, so the numbers may differ from today's online Black Friday shopping. Even so, it's still widely cited as a landmark study showing that demand from shoppers facing a stockout doesn't stay put. It scatters in several directions.
These substitute purchases distort your sales data, too. When a customer buys a similar item because the one they wanted is gone, that substitute's sales look stronger than they really are. One product's demand ends up credited to another product's performance, a pattern much like cannibalization. If you want to dig deeper into how reported sales can diverge from actual demand, check out our article on the cannibalization effect.

Start by checking whether any of your Black Friday SKUs this year have already fallen into this loop.
Four data points you need for Black Friday planning
If sell-out volume alone can't tell you what demand really was, what else should you be looking at? In practice, planners typically review four types of data: stockout history, substitute product sales, promotions, and lead time.
Stockout history: setting a baseline for which sales you can trust
Selling 100 units means very different things on a day when stock lasted from open to close versus a day when you sold out at 2 p.m. If you had enough inventory all day, it's reasonable to treat sales as demand. If you stocked out at 2 p.m., actual demand was likely well above 100. That's why it matters to record not just how much you sold, but when you stocked out.
With stockout timestamps, you can more accurately judge whether you lost demand and, if so, how much. One caveat: for events like Black Friday, where orders flood in the moment a sale opens, simply extrapolating the pre-stockout sales rate across the remaining hours can overstate lost demand. Still, one study found that recording stockout timing alone eliminated an average of 76.1% of the expected profit loss that results from relying only on whether a stockout occurred. Since this comes from a modeled setting, results will vary in real businesses, but it makes a strong case for capturing stockout timing.
In practice, you can start by collecting these records at the SKU level: the moment inventory hit zero in your order management system, the time an item was marked sold out on your online store, and out-of-stock reports from physical stores. If your historical data doesn't include stockout times, even flagging the days when inventory ran out completely goes a long way toward preventing you from mistaking sales for actual demand.
Stockout history is also a key reference point when analyzing items whose sales suddenly dropped. Many of those items didn't lose demand at all. They simply sold less because there wasn't enough stock. Looking at stockout history alongside sales lets you separate items where demand truly declined from items that were just supply-constrained. Items with genuinely declining demand are also worth flagging for future overstock risk.
The same sales figure should feed into your next plan differently depending on stockout conditions. Here are the three scenarios planners run into most often.
Substitute product sales: tracing where lost demand went
As we noted earlier, when customers looking for a sold-out item buy something else instead, your sales data gets distorted a second time. If you don't account for this shift, the sold-out item's true demand gets understated and the substitute's demand gets overstated, and both errors carry into next season's plan. Use a substitute's Black Friday performance as-is for your baseline, and you may end up with excess substitute inventory in a season when the original item is well stocked.

Signs of substitution usually show up around the time of the stockout. If, after an item sells out, you see an unusual jump in sales of similarly priced products in the same category, or a different pack size from the same brand, some of the original item's demand has likely shifted over. To make an accurate call, you also need to check for other factors such as discounts or changes in product placement. In these cases, review the sales trends of both products together and adjust each one's quantity for next season with the possible demand shift in mind.
In practice, a good starting point is to pair each key item with its likely substitutes in advance. Even if you can't calculate precise substitution rates, recording how substitute sales changed before and after a stockout gives you a useful reference when adjusting quantities for both items next season.
Promotions: separating event lift from baseline demand
You need promotion records to distinguish event-driven demand from baseline demand. If an item sold three times its usual volume during Black Friday, for example, it doesn't make sense to triple next month's baseline. Event sales are the combined result of many factors at once: discount depth, display placement, coupons, bundle offers, and more.
Right before an event, some customers hold off on buying while they wait for the discounts. Right after, sales often dip below normal for a while. In one forecasting experiment with 157 participants, those given no guidance assumed post-promotion periods would look like normal periods, while those told about the post-promotion dip forecast more accurately. If you mistake these pre- and post-event dips for baseline demand, you can end up lowering your baseline for regular seasons as well.
In practice, it helps to build a promotion calendar that captures each event's name, dates, discount rate, participating SKUs, and sales channels, and to link it to your sales data by SKU and date. With that in place, your forecasting model can learn to separate promotional effects from baseline demand. Planners can also compare quantities against past events with similar conditions when preparing for the next Black Friday.
Lead time: your last chance to lock in quantities
Lead time is the time between placing an order and receiving it. It can vary widely between domestically produced and imported products.
The longer the lead time, the earlier you have to commit to quantities, and with less information. With a 60-day lead time, for example, you need to place your order two months before Black Friday, and even if demand turns out to be higher, it's hard to increase quantities after that. That's why, for long-lead-time items, it pays to build separate high-demand and low-demand scenarios rather than relying on a single forecast, so you know your range of response ahead of time.
In practice, it helps to record each item's lead time in your demand planning sheet and work backward from the Black Friday date to set order cutoff dates.
Connecting stockout data to quantity planning with Deepflow
Planners can collect all of the data above by hand. But once you're managing thousands of SKUs, just figuring out where to start becomes a challenge. Here, we'll walk through how a planner reviews data after Black Friday using Deepflow Forecast, ImpactiveAI's demand forecasting solution.
Right after Black Friday, where should you look first?
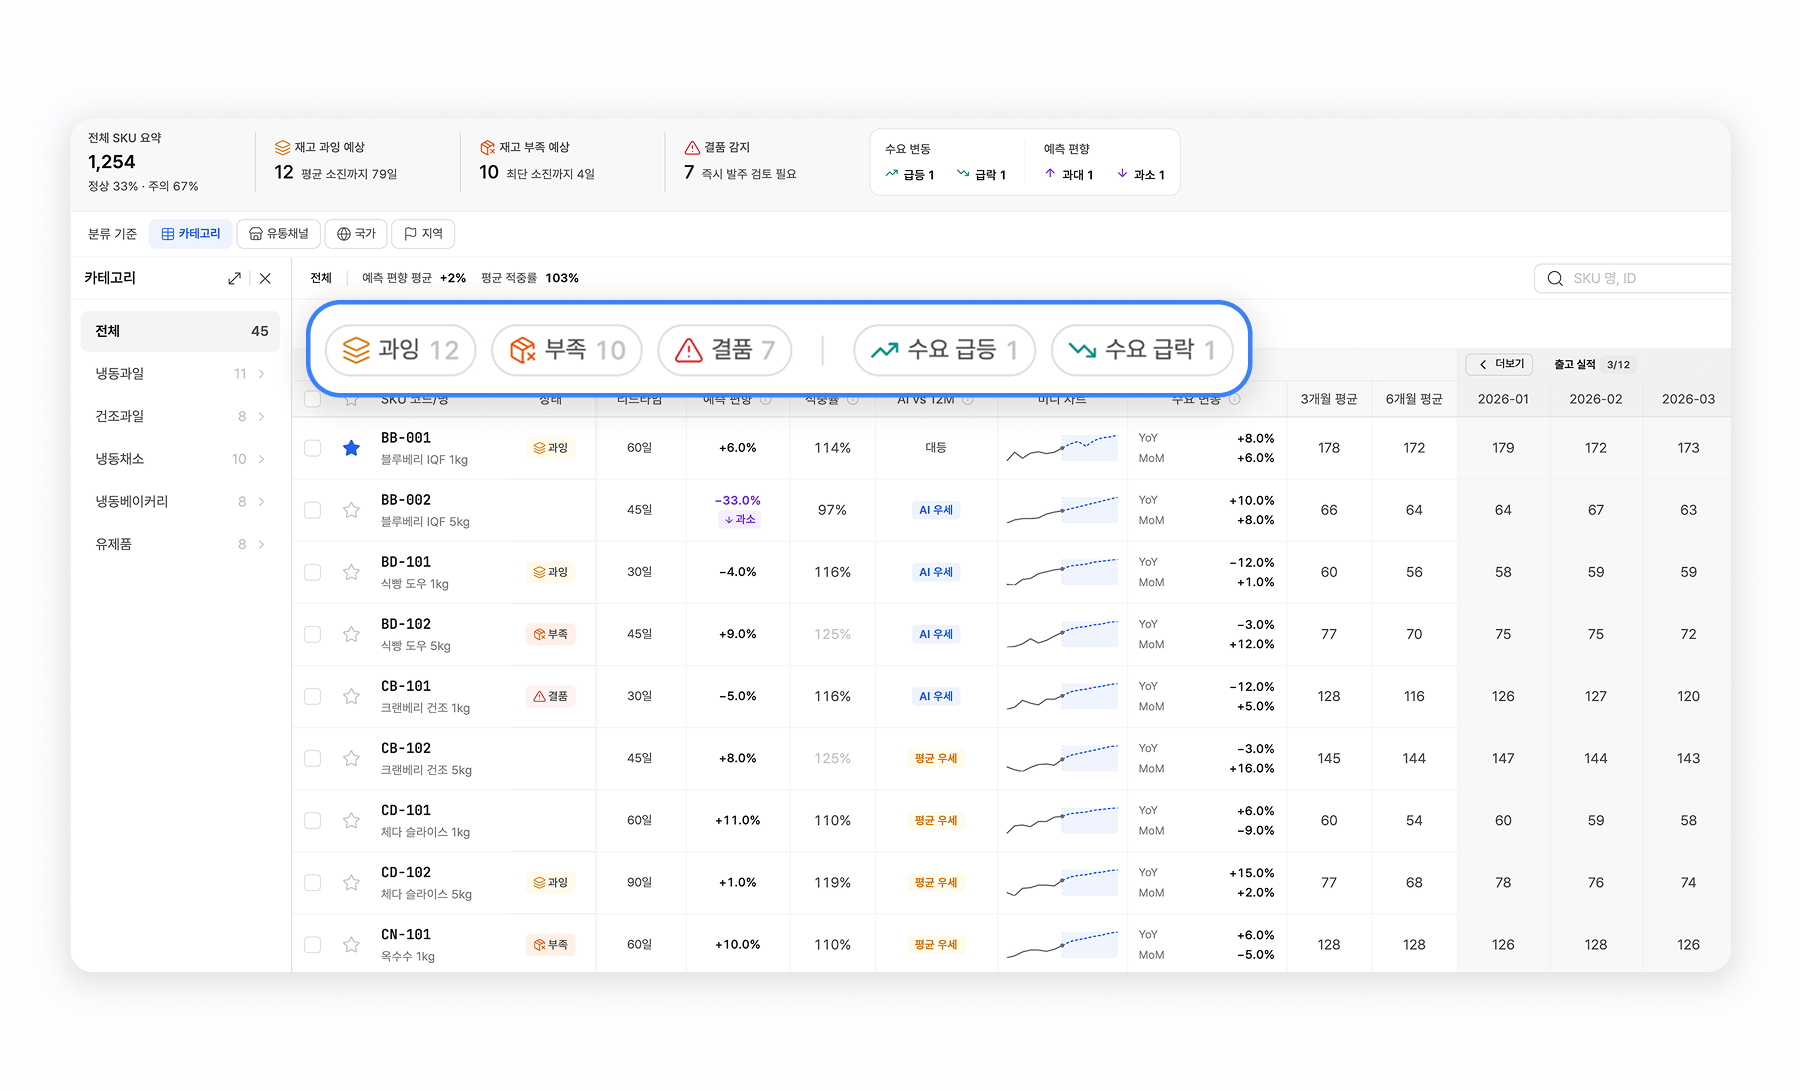
Once an event wraps up, you're left with a mix of sold-out items, items with leftover stock, and items whose sales missed expectations. Deepflow categorizes each item's inventory status as normal, low, excess, or out of stock. It also flags items whose demand shifted significantly from the previous month or the same period last year. Planners can start by opening the items that stocked out one by one and, using the criteria above, decide how much they can trust this season's sales figures.
An item sold out early. How much more should you order next time?
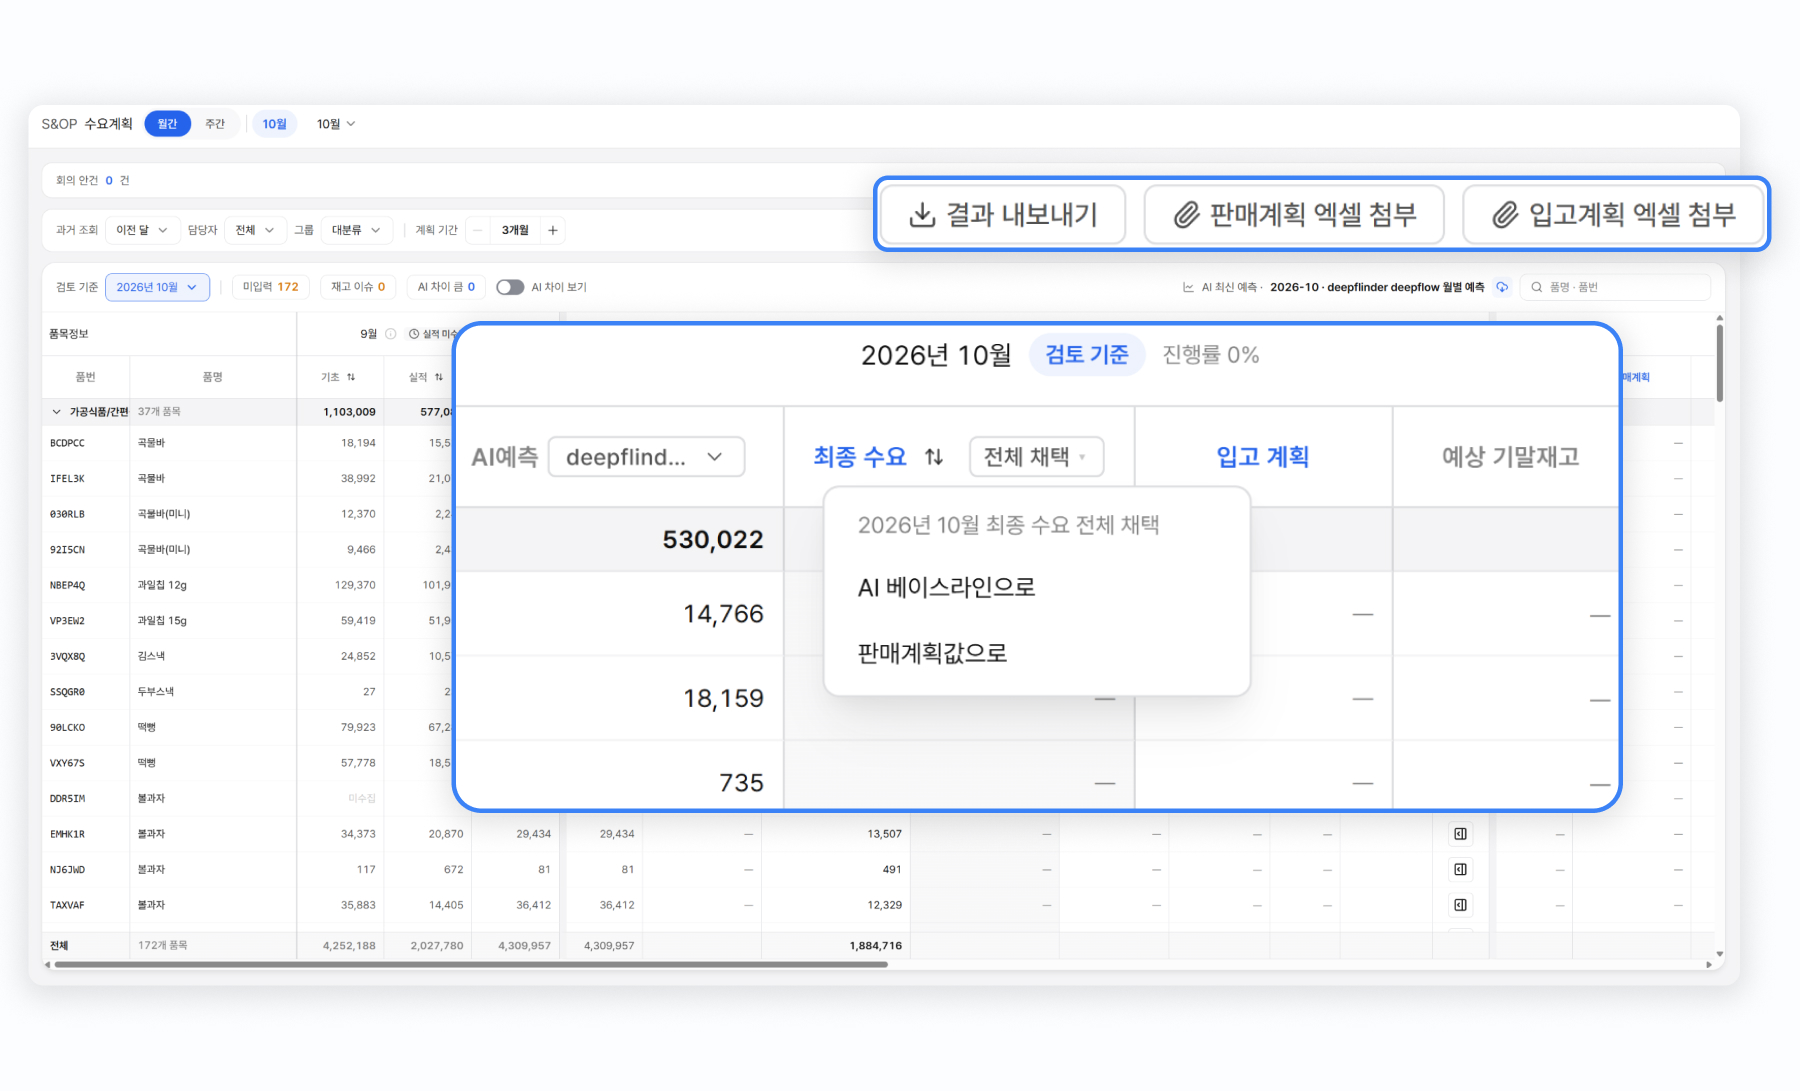
Selling out early doesn't automatically mean you should order more. You have to weigh the cost of excess inventory against the risk of lost sales. Based on each item's historical forecast error and bias, Deepflow lets you compare multiple scenarios side by side: the AI-recommended base quantity, a reduced quantity to limit overstock, and an increased quantity to prevent stockouts.
Lead time is another key factor. If an item takes 30 days to arrive, the question becomes whether current inventory can cover expected demand over those 30 days. Deepflow shows shortage and excess based on the lead time set for each item.
How do you capture what happened this year?
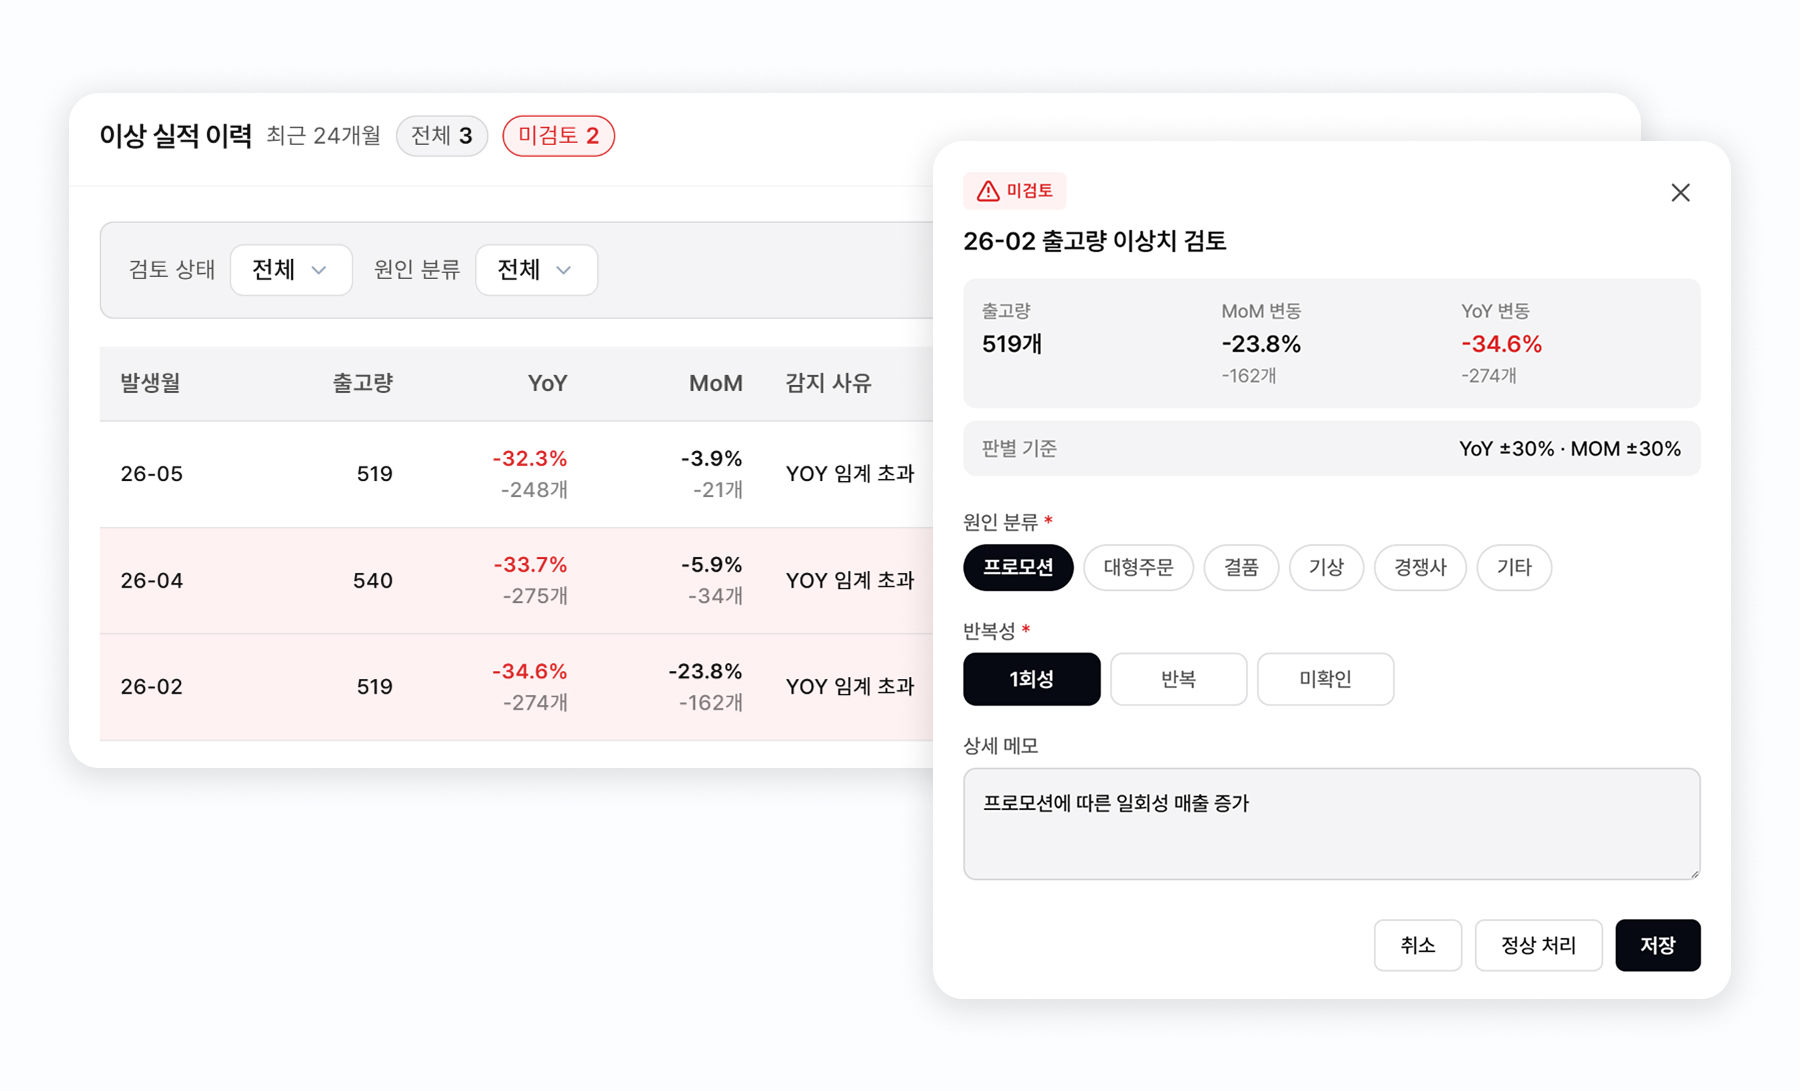
One common frustration when preparing for the next Black Friday is the lack of records showing what actually happened this year. With Deepflow's anomaly management feature, you can document exactly why sales swung during volatile periods, whether a drop was caused by a stockout or a spike was driven by a promotion. These records help you interpret next season's results and, over time, become training data that reflects your business context, making the forecasting model more accurate.
At every stage, the final quantity decision rests with the planner. Deepflow's role is to support that decision by surfacing item-level lists, multiple scenarios, and performance records in one place. ImpactiveAI currently helps leading Korean manufacturers and retailers reduce inventory costs, and one food company that adopted Deepflow cut its inventory risk by more than 26%.
Turn this year's Black Friday results into next season's plan
Your Black Friday quantities for this year are probably locked in by now. What you can do at this point is turn this season's results into evidence for your next plan.
After the event, record more than just sales at the SKU level. Note when each stockout happened, how long it lasted, what discount conditions applied, and which substitutes picked up sales in place of sold-out items. With these records in hand, you can base next season's quantities on real evidence instead of just the ceiling your sales happened to hit.
Deepflow's anomaly management feature makes this process easier. Organize the stockout data from this year's Black Friday now, and you'll be able to plan next season's quantities faster and more accurately.
References
- Ministry of Data and Statistics, Online Shopping Trends, November 2025 (2026)
- Adobe, Holiday Shopping Season Drove a Record $257.8 Billion Online (2026)
- Ding, Huh, Rong, Feature-Based Inventory Control with Censored Demand, Manufacturing & Service Operations Management (2024)
- Steeneck, Eng-Larsson, Jauffred, Estimating Lost Sales for Substitutable Products with Uncertain On-Shelf Availability, Manufacturing & Service Operations Management (2021)
- Gruen, Corsten, Bharadwaj, Retail Out-of-Stocks: A Worldwide Examination of Extent, Causes and Consumer Responses, GMA·FMI·CIES (2002)
- Jain, Rudi, Wang, Demand Estimation and Ordering Under Censoring: Stock-Out Timing Is (Almost) All You Need, Operations Research (2015)
- Hewage, Perera, De Baets, Forecast Adjustments during Post-Promotional Periods, European Journal of Operational Research (2022)