.svg)

.svg)
%202.svg)
Mastering the 8-Step Standard Process for Sales Forecasting Accuracy
Sales forecasting is one of the most fundamental yet challenging tasks in corporate management. Whether it's setting next year’s budget, deciding when to hire, or timing capital expenditures (CapEx), all these decisions start with a sales forecast. However, many professionals find it daunting to know where to begin. Simply plotting trend lines on an Excel sheet of historical data often fails to capture the volatility of today’s market.
This guide outlines an 8-step standard process designed for immediate practical application to help you achieve high-precision forecasting.
Why Sales Forecasting is Integral to Corporate Strategy
Sales Forecasting is more than just estimating future revenue figures. Nearly every facet of business operations—including budgeting, investment appraisal, workforce planning, and inventory management—relies on it. High accuracy empowers leadership to make informed decisions, whereas inaccurate forecasts lead to a domino effect of issues like over-investment or resource shortages.
Sales forecasting delivers three core values to an organization:
Foundation for Financial Planning: It provides the baseline for quarterly and annual budgeting. Without it, rational resource allocation is virtually impossible.
Early Warning System for Risk: By identifying potential revenue dips in advance, organizations gain the "lead time" necessary to implement cost-cutting measures or pivot to alternative plans.
Proactive Demand Sensing: Anticipating which products are scaling and which are plateauing allows for timely adjustments in marketing strategies and R&D pipelines.
Ultimately, sales forecasting acts as a compass, providing clear direction in an uncertain business environment.
The 8-Step Standard Process for Practical Sales Forecasting
Based on standard frameworks recommended by leading ERP and financial solution providers like Oracle, these steps are optimized for real-world application.
Step 1. Aggregating Accurate Sales Data
Forecasting begins with a "single source of truth." You must collect not only historical financial statements (P&L, Balance Sheet, Cash Flow) but also granular, up-to-date sales data such as order statuses, shipment logs, and channel-specific revenue.
- Pro-tip: Automating data ingestion reduces manual entry errors and ensures consistent categorization of cost items. Remember, garbage in, garbage out—the quality of your data dictates the quality of your forecast.
Step 2. Defining the Forecasting Horizon

Determine the time frame for your projections. It is effective to run Long-term Strategic Forecasts (Annual) alongside Short-term Operational Forecasts (Quarterly/Monthly). While long-term views help set the vision, short-term views provide the precision needed for day-to-day execution.
Step 3. Incorporating Internal Growth Drivers
Factor in variables controlled by the company, such as new product launch schedules, market expansion plans, scheduled marketing campaigns, production capacity changes, and headcount growth. Relying solely on historical trends without these "drivers" creates a gap between your forecast and your actual business plan.
Step 4. Analyzing External Variables

Closely examine macro-environmental factors: shifts in consumer demand, seasonality, regulatory changes, and macroeconomic indicators (interest rates, FX rates, raw material indices). For industries sensitive to volatility (e.g., manufacturing/logistics), performing Scenario Analysis based on these variables is highly recommended.
Step 5. Assessing Risks and Constraints
Build "what-if" scenarios that include potential bottlenecks such as supply chain disruptions, talent attrition, sudden drops in consumer spending, or raw material shortages. Defining these allows you to categorize outcomes into Upside (Optimistic), Base, and Downside (Pessimistic) scenarios.
Step 6. Selecting the Right Tools
Choose a tool that fits your organizational scale. Small teams may find Excel’s FORECAST functions sufficient. However, mid-to-large enterprises managing hundreds of SKUs or complex supply chains require AI-powered dedicated solutions capable of automated high-volume processing.
Step 7. Determining the Methodology
- Time-Series Analysis: Best when stable historical data is available.
- Regression Analysis: Useful when revenue drivers (variables) are clearly identified.
- Machine Learning/Deep Learning: Increasingly popular for comparing and selecting from multiple models to overcome the limitations of a single statistical approach.
Step 8. Continuous Monitoring and Iteration
Forecasting is not a "one-and-done" task. You must regularly track the Variance between actual performance and forecasted figures. Implementing Dynamic Dashboards allows for real-time tracking and immediate response to anomalies. This feedback loop is what ultimately drives continuous improvement in accuracy.
Common Pitfalls That Undermine Accuracy
- Rear-view Mirror Bias: Assuming past growth rates will continue indefinitely without considering structural market shifts or new competitors.
- Intuition-based "Finger-in-the-wind" Estimates: Relying on gut feeling or using "round numbers" without evidence. Always base figures on quotes, contracts, and CRM pipeline data.
- Ignoring Constraints: Failing to account for supply chain limits or labor shortages leads to unattainable targets.
- Set-it-and-forget-it Mentality: Keeping a January forecast fixed until December ignores market evolution.
The Evolution of AI-Powered Forecasting
Machine Learning (ML) for Precision
ML algorithms automatically learn complex patterns in historical data, providing faster and more precise results than manual efforts. Random Forest or Decision Tree models automate data segmentation, while Deep Learning captures non-linear patterns hidden deep within the data.
Generative AI for Actionable Insights
Generative AI is now being used to summarize complex statistical outputs into natural language. It can automatically generate Comparative Scenario Reports, allowing executives and sales reps (who may not be data scientists) to intuitively understand and act on the data.
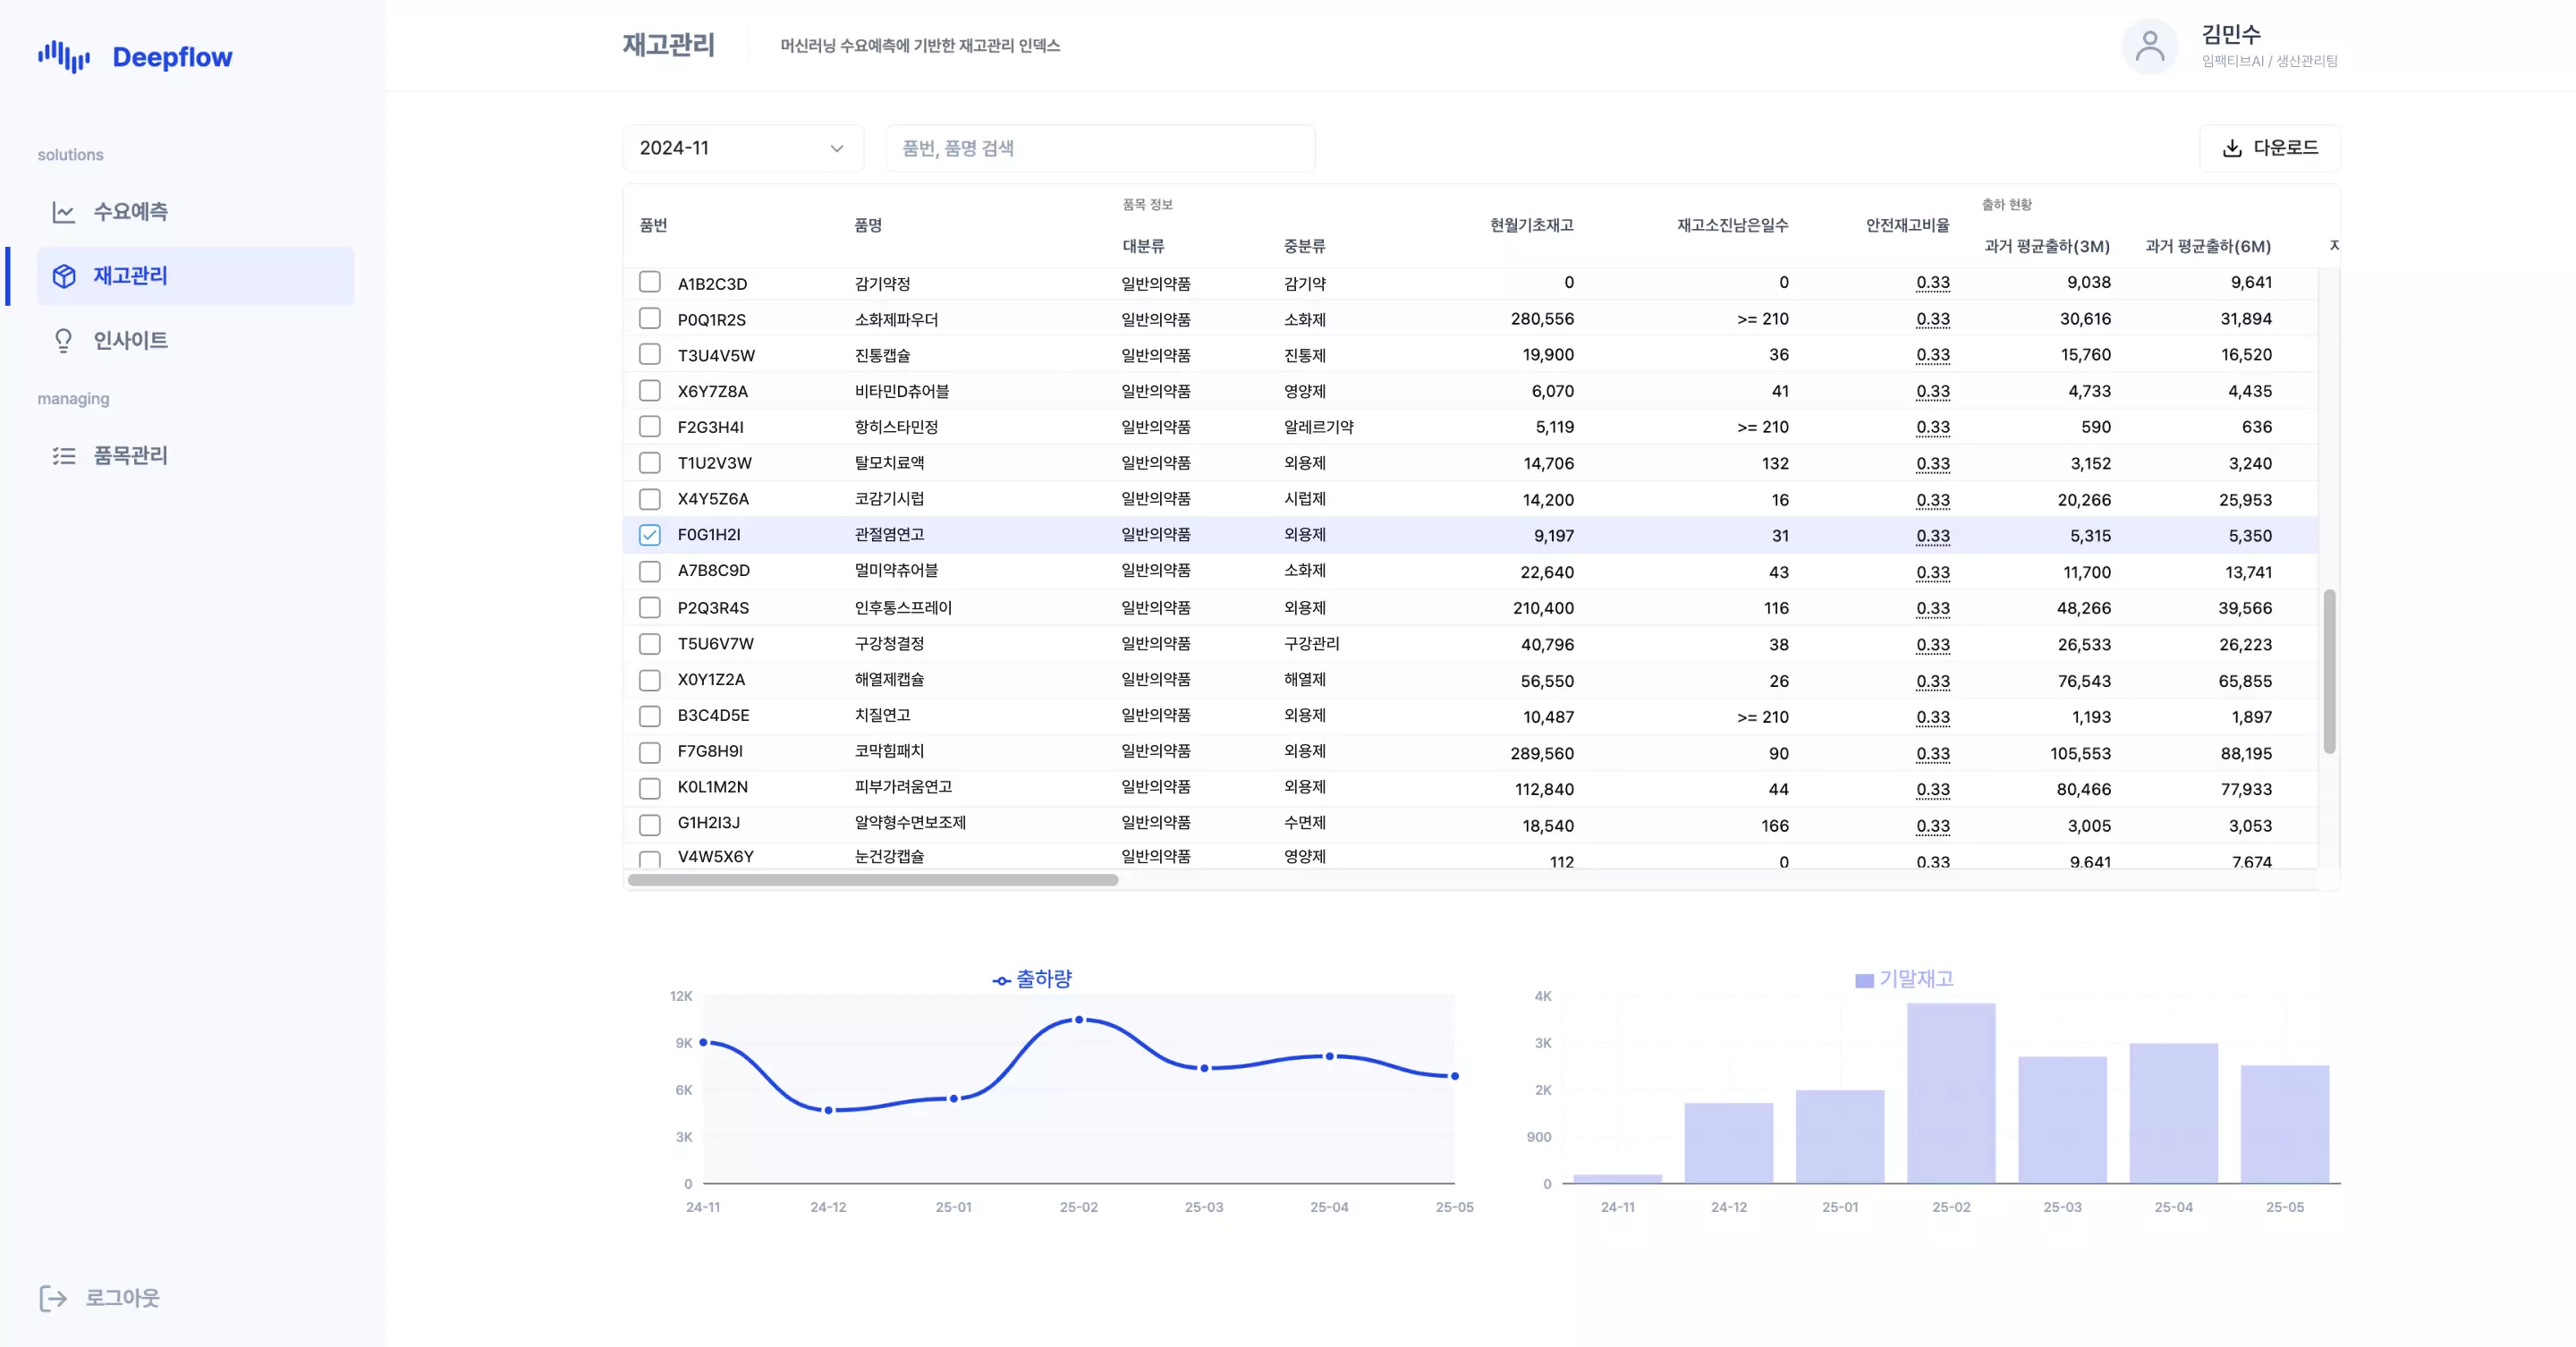
Practical Application: Deepflow by Impactive AI
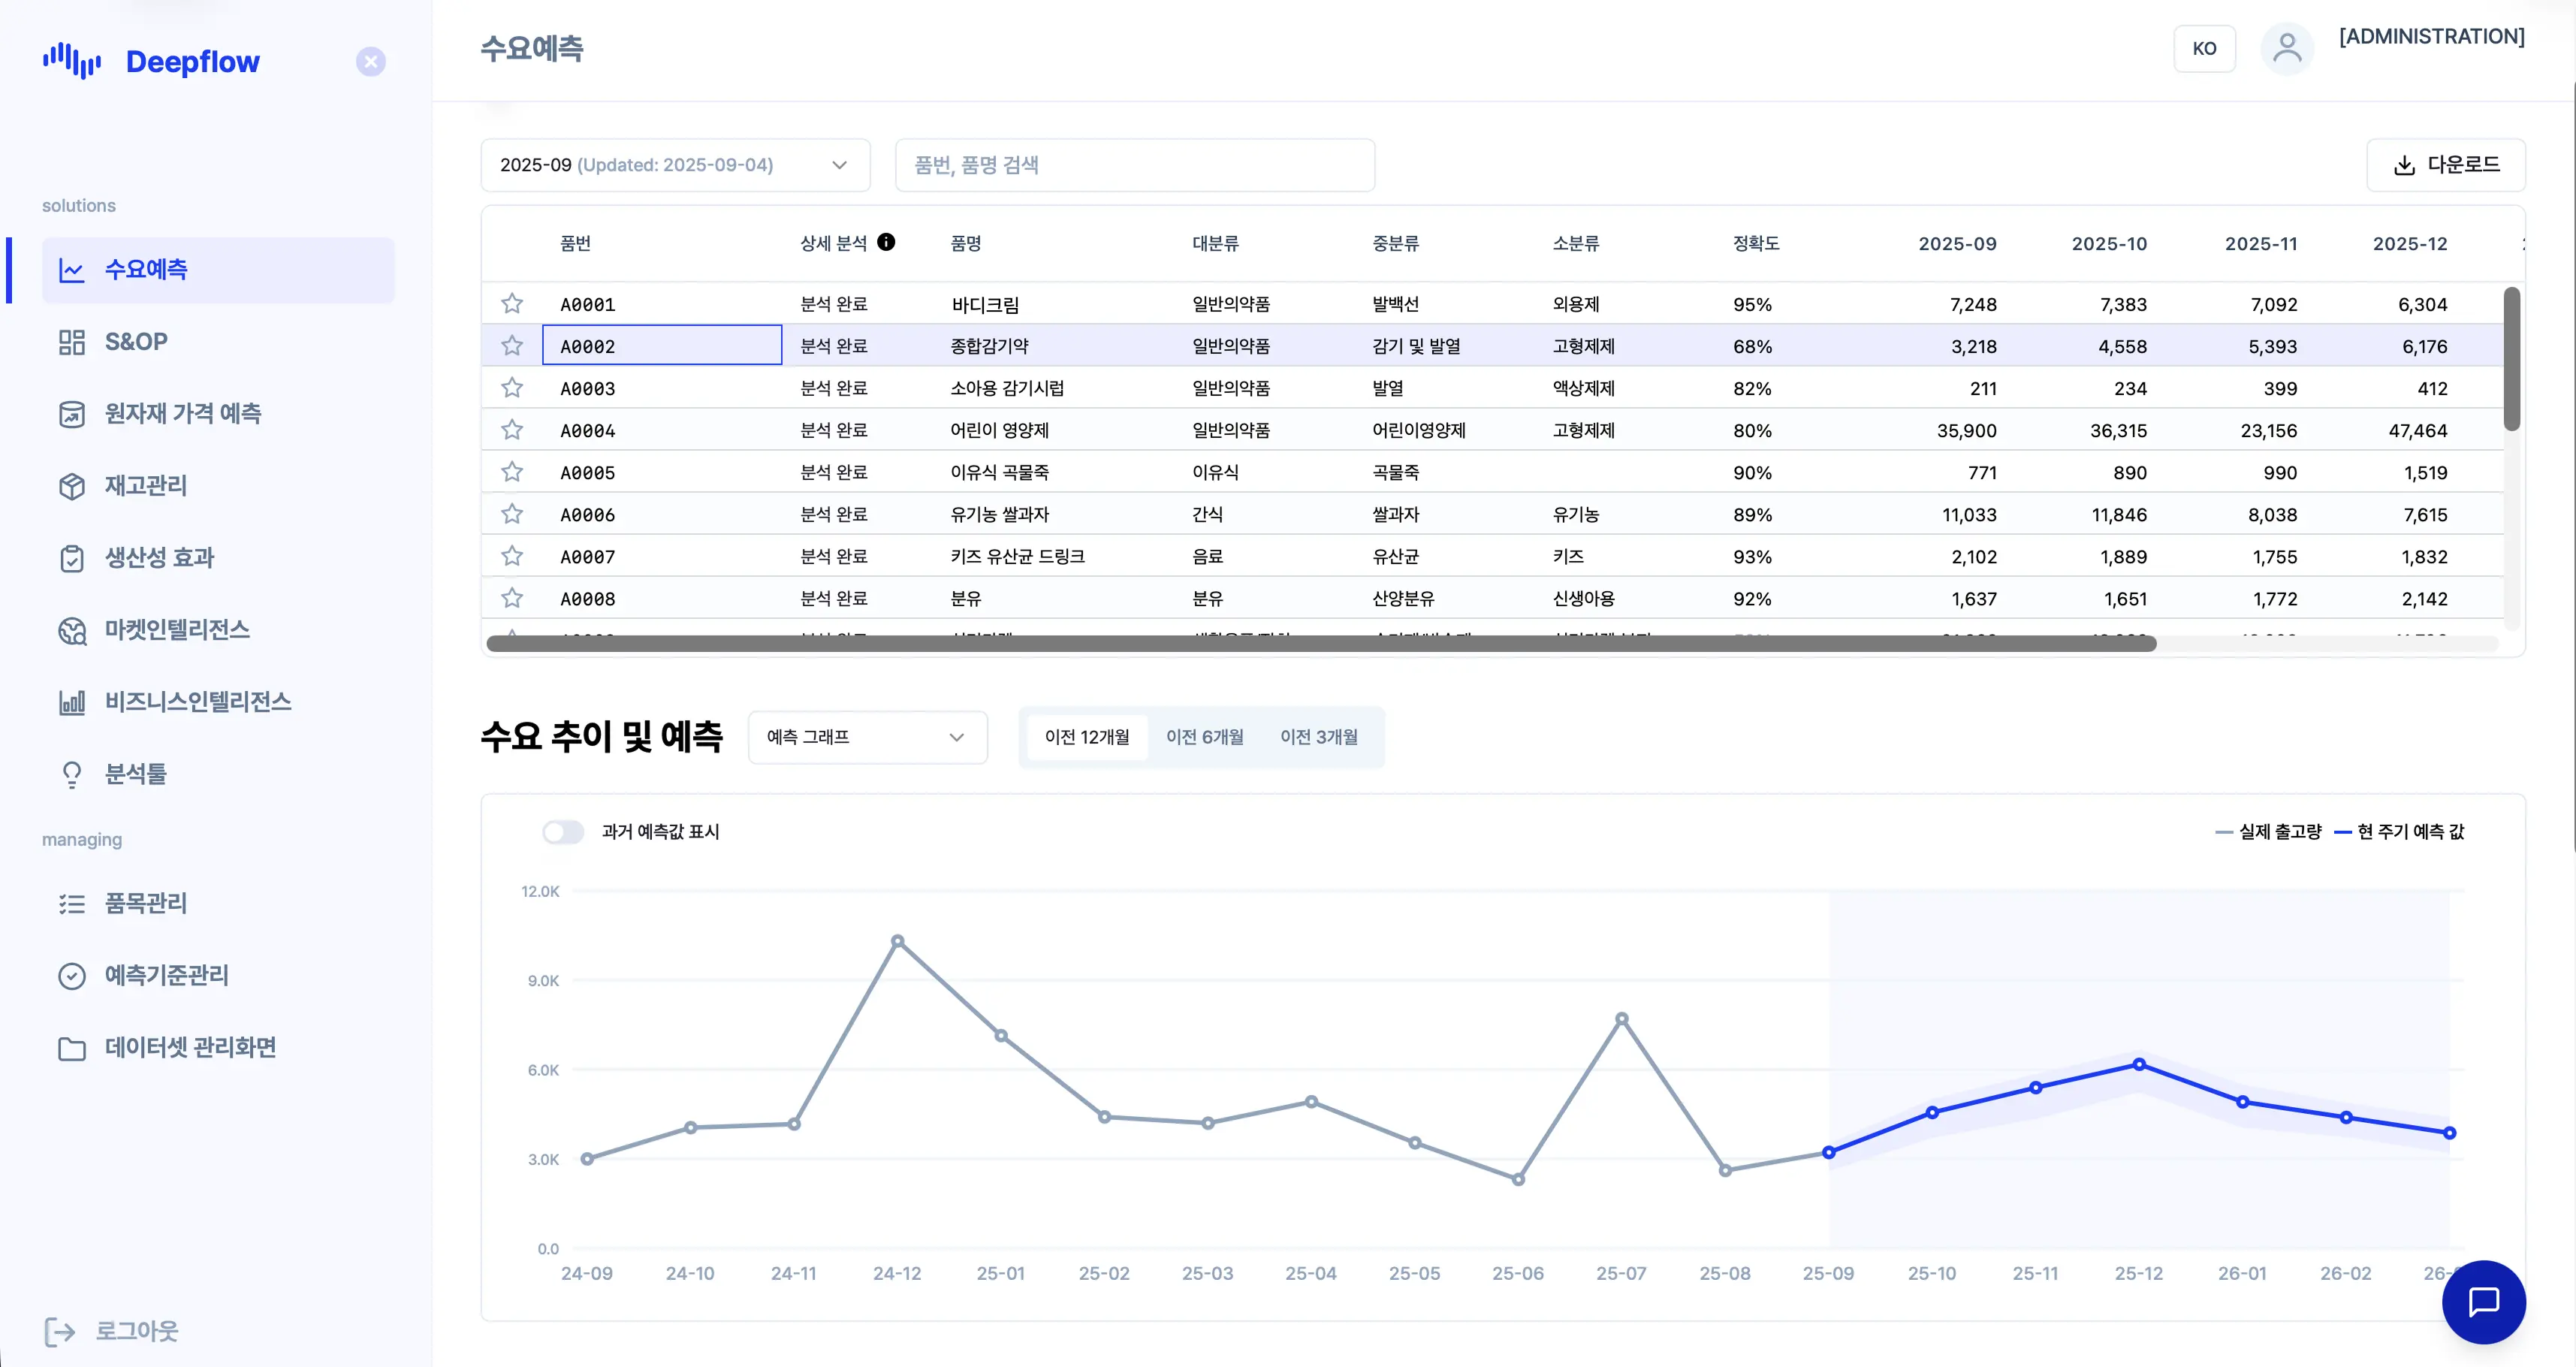
Deepflow serves as a prime example of AI integration. It visualizes sales volume forecasts for the next 6 to 12 months.
What sets Deepflow apart for practitioners is that it provides the "Why" (Evidence) and the "How" (Action Plan) alongside the numbers. Its LLM-powered reports interpret seasonal patterns and demand outlooks, offering optimized action plans for Sales, Marketing, and SCM teams. By handling everything from data ingestion to external variable analysis within one platform, it provides a turnkey solution for systematizing the 8-step process.
Conclusion: Starting is the Fastest Way Forward
The goal of sales forecasting isn't to build a "perfect" model, but to establish a systematic process that iterates and improves. By benchmarking your organization against these 8 steps, you can identify gaps and start making data-driven decisions today. When Sales, Marketing, Production, and Finance all align on the same set of numbers, a forecast truly transforms into execution.
.svg)


.svg)